Target 2004 Annual Report Download - page 34
Download and view the complete annual report
Please find page 34 of the 2004 Target annual report below. You can navigate through the pages in the report by either clicking on the pages listed below, or by using the keyword search tool below to find specific information within the annual report.-
 1
1 -
2
-
3
-
4
-
5
-
6
-
7
-
8
-
9
-
10
-
11
-
12
-
13
-
14
-
15
-
16
-
17
-
18
-
19
-
20
-
21
-
22
-
23
-
 24
24 -
 25
25 -
 26
26 -
 27
27 -
 28
28 -
 29
29 -
 30
30 -
 31
31 -
 32
32 -
 33
33 -
 34
34 -
 35
35 -
 36
36 -
 37
37 -
 38
38 -
 39
39 -
 40
40 -
 41
41 -
 42
42 -
 43
43 -
 44
44
 |
 |

32
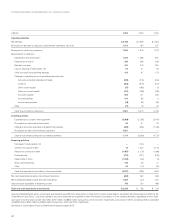
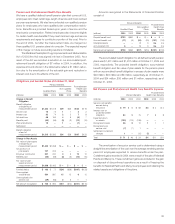
At year-end, our debt portfolio, including adjustments related to
swap transactions discussed in the following derivatives section, was
as follows:
Notes Payable and Long-term Debt
January 29, 2005 January 31, 2004
(millions) Rate*Balance Rate*Balance
Notes payable —% $ — —% $ —
Notes and debentures:
Due 2004–2008 4.0 4,045 3.1 4,953
Due 2009–2013 5.9 3,726 5.8 3,795
Due 2014–2018 3.3 234 2.3 227
Due 2019–2023 9.3 213 9.3 214
Due 2024–2028 6.7 325 6.7 400
Due 2029–2033 6.6 904 6.7 1,300
Total notes payable,
notes and debentures** 5.2% $9,447 4.7% $10,889
Capital lease obligations 91 129
Less: current portion (504) (863)
Notes payable and
long-term debt $9,034 $10,155
** Reflects the weighted average stated interest rate as of year-end, including the
impact of interest rate swaps.
** The estimated fair value of total notes payable, notes and debentures, using a
discounted cash flow analysis based on our incremental interest rates for similar
types of financial instruments, was $10,171 million at January 29, 2005 and
$11,681 million at January 31, 2004.
Required principal payments on long-term debt over the next
five years, excluding capital lease obligations, are $501 million in 2005,
$751 million in 2006, $1,321 million in 2007, $1,451 million in 2008
and $751 million in 2009.
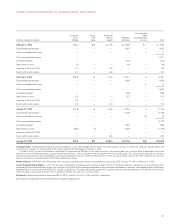
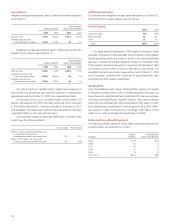
Derivatives
Our derivative instruments are primarily interest rate swaps which
hedge the fair value of certain debt by effectively converting interest
from a fixed rate to a variable rate. We also hold derivative instruments
to manage our exposure to risks associated with the effect of equity
market returns on our non-qualified defined contribution plans as
discussed on page 34.
At January 29, 2005 and January 31, 2004, interest rate swaps
were outstanding in notional amounts totaling $2,850 million and
$2,150 million, respectively. The change in market value of an interest
rate swap as well as the offsetting change in market value of the
hedged debt is recognized into earnings in the current period.
Ineffectiveness would result when changes in the market value of the
hedged debt are not completely offset by changes in the market value
of the interest rate swap. There was no ineffectiveness recognized in
2004 or 2003 related to these instruments. The fair value of outstand-
ing interest rate swaps and net unamortized gains from terminated
interest rate swaps was $45 million at January 29, 2005 and $97
million at January 31, 2004.
During 2004, we entered into two interest rate swaps with
notional amounts of $200 million and two interest rate swaps with
notional amounts of $250 million. We also terminated an interest rate
swap with a notional amount of $200 million, resulting in a loss of
$16 million that will be amortized into expense over the remaining life
of the hedged debt. During 2003, we entered into interest rate swaps
with notional amounts of $200 million, $500 million and $400 million.
We also terminated an interest rate swap with a notional amount of
$400 million, resulting in a gain of $24 million that will be amortized
into income over the remaining life of the hedged debt. In 2004 and
2003, the gains and losses amortized into income for terminated
swaps were not material to our results of operations.
Interest Rate Swaps Outstanding at Year-end
(millions)
January 29, 2005 January 31, 2004
Notional Receive Pay Notional Receive Pay
Amount Fixed Floating*Amount Fixed Floating*
$500 7.5% 2.4% $500 7.5% 1.2%
200 5.8 3.3 ———
550 4.6 3.3 550 4.6 1.3
500 4.4 3.2 500 4.4 1.2
400 4.4 3.3 400 4.4 1.4
200 3.9 2.4 ———
250 3.8 2.5 ———
250 3.8 2.4 ———
———200 4.9 1.1
$2,850 $2,150
* Reflects floating interest rate accrued at the end of the year.
The weighted average life of the interest rate swaps was approximately 3 years at
January 29, 2005.
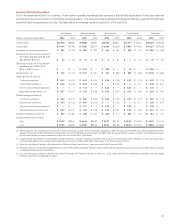
Leases
Assets held under capital leases are included in property and equip-
ment and are charged to depreciation and interest over the life of the
lease. Operating leases are not capitalized and lease rentals are
expensed on a straight-line basis over the life of the lease. Rent
expense on buildings, classified in selling, general and administrative
expense, includes percentage rents that are based on a percentage
of retail sales over contractual levels. Total rent expense was $240
million in 2004, $150 million in 2003 and $150 million in 2002. Most
of the long-term leases include options to renew, with terms varying
from one to 50 years. Certain leases also include options to purchase
the property.
Future minimum lease payments required under noncancelable
lease agreements existing at January 29, 2005, were:
Future Minimum Lease Payments
Operating Capital
(millions) Leases Leases
2005 $146 $12
2006 142 12
2007 137 13
2008 117 13
2009 102 12
After 2009 2,405 127
Total future minimum lease payments $3,049*** $189
Less: Interest*(98)
Present value of minimum capital lease payments $91**
*** Calculated using the interest rate at inception for each lease.
*** Includes current portion of $3 million.
*** Total contractual lease payments include certain options to extend lease terms,
in the amount of $1,415, that are expected to be exercised because the invest-
ment in leasehold improvement is significant.