Target 2004 Annual Report Download - page 36
Download and view the complete annual report
Please find page 36 of the 2004 Target annual report below. You can navigate through the pages in the report by either clicking on the pages listed below, or by using the keyword search tool below to find specific information within the annual report.-
 1
1 -
2
-
3
-
4
-
5
-
6
-
7
-
8
-
9
-
10
-
11
-
12
-
13
-
14
-
15
-
16
-
17
-
18
-
19
-
20
-
21
-
22
-
23
-
24
-
25
-
 26
26 -
 27
27 -
 28
28 -
 29
29 -
 30
30 -
 31
31 -
 32
32 -
 33
33 -
 34
34 -
 35
35 -
 36
36 -
 37
37 -
 38
38 -
 39
39 -
 40
40 -
 41
41 -
 42
42 -
 43
43 -
 44
44
 |
 |

34
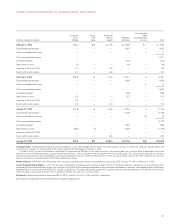
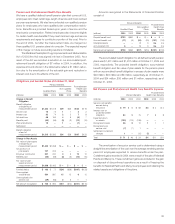
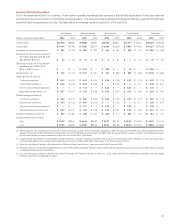
Options and Performance Share Awards Outstanding
Options
Total Outstanding Currently Exercisable Performance
Shares
(options and shares Number of Average Average Number of Average Average Potentially
in thousands) Options Price*Life** Options Price*Life** Issuable
February 2, 2002 31,315 $24.07 5.7 17,629 $17.04 5.7 —
Granted 6,096 30.60 552
Canceled (561) 35.55
Exercised (2,063) 12.22
February 1, 2003 34,787 $25.73 5.5 21,931 $20.89 5.4 552
Granted 4,638 38.34 573
Canceled (407) 34.77
Exercised (2,859) 12.58
January 31, 2004 36,159 $28.28 6.2 23,689 $24.48 5.2 1,125
Granted 4,072 49.12 629
Canceled/forfeited (513) 35.32 (73)
Exercised/earned (7,727) 20.95 (73)
January 29, 2005 31,991 $32.59 5.8 22,102 $28.79 5.3 1,608
** Weighted average exercise price.
** Weighted average contractual life remaining in years.
Total compensation expense related to stock-based compen-
sation, which is the total fair value of shares vested was $60 million,
$57 million and $49 million, during 2004, 2003 and 2002, respectively.
The weighted-average grant date fair value of options granted during
2004, 2003 and 2002 was $13.10, $11.04 and $10.07, respectively.
The total intrinsic value of options (the amount by which the stock
price exceeded the strike price of the option on the date of exercise)
that were exercised during 2004, 2003 and 2002 was $201 million,
$72 million and $66 million, respectively.
Nonvested Options and Performance Share Awards
Weighted Average Weighted Average
Stock Fair Value at Performance Fair Value at
(options and shares in thousands) Options Grant Date Shares Grant Date
Nonvested at February 1, 2004 12,470 $11.07 1,125 $34.33
Granted 4,072 13.10 419 49.43
Vested/earned (6,237) 11.25 (73) 34.44
Forfeited/cancelled (416) 11.00 (73) 34.44
Nonvested at January 29, 2005 9,889 $11.83 1,398 $38.84
As of January 29, 2005, there was $104 million of total unrec-
ognized compensation expense related to nonvested share-based
compensation arrangements granted under our plans. That cost is
expected to be recognized over a weighted-average period of 1.5 years.
We have elected to adopt the provisions of SFAS No. 123R
in 2004 under the modified retrospective transition method. The
beginning balances of deferred taxes, paid-in capital and retained
earnings for 2003 have been restated by $54 million, $143 million
and $90 million, respectively, to recognize compensation cost for
fiscal years 1996 through 2002 in the amounts previously reported
in the Notes to Consolidated Financial Statements under the
provisions of SFAS No.123. The requirements of SFAS No.123R are
discussed on page 23.
The Black-Scholes model was used to estimate the fair value of
the options at grant date based on the following assumptions:
2004 2003 2002
Dividend yield .7% .8% .8%
Volatility 22% 29% 35%
Risk-free interest rate 3.8% 3.0% 3.0%
Expected life in years 5.5 5.0 5.0
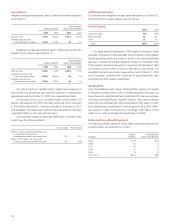
Defined Contribution Plans
Employees who meet certain eligibility requirements can participate
in a defined contribution 401(k) plan by investing up to 80 percent of
their compensation. Highly compensated employees, however, are
further limited by federal law and related regulation. Subject to these
limits, we match 100 percent of each employee’s contribution up to
5 percent of total compensation. Our contribution to the plan is initially
invested in Target Corporation common stock but once vested after
a period of three years the amounts are free to be diversified. Benefits
expense related to these matching contributions was $118 million,
$117 million and $111 million in 2004, 2003 and 2002, respectively.
In addition, we maintain other non-qualified, unfunded plans that
allow participants who are otherwise limited by qualified plan statutes
or regulations. They can defer compensation including remaining
company match amounts, and earn returns tied to the results of either
our 401(k) plan investment choices, including Target stock, or in the
case of a frozen plan, market levels of interest rates, plus an additional
return determined by the terms of each plan. We recognized benefits
expense for these non-qualified plans of $63 million and $86 million in
2004 and 2003, respectively, and income of $20 million in 2002. We
manage the risk of offering these retirement savings plans through a
variety of activities, which include investing in vehicles that offset a
substantial portion of our exposure to these returns. Including the
impact of these related investments, net benefits expense from these
plans was $23 million, $28 million, and $16 million in 2004, 2003, and
2002, respectively. We adjusted our position in some of the invest-
ment vehicles resulting in the repurchase of 0.8 million, 1.5 million
and 0.5 million shares of our common stock in 2004, 2003 and 2002,
respectively.
In 2004 and 2003, certain retired executives accepted our offer to
exchange our obligation to them under our frozen non-qualified plan for
cash or deferrals in our current non-qualified plans, which resulted in
expense of $17 million in both years. Additionally, during 2002, certain
non-qualified pension and survivor benefits owed to current executives
were exchanged for deferrals in our current non-qualified plans and
certain retired executives accepted our offer to exchange our obligation
to them in our frozen non-qualified plan for deferrals in our current
plans. These exchanges resulted in expense of $33 million. We expect
lower future expenses as a result of these transactions because they
were designed to be economically neutral or slightly favorable to us.
Participants in our non-qualified plans deferred compensation
of $33 million, $42 million and $35 million in 2004, 2003 and 2002,
respectively.