Target 2004 Annual Report Download - page 20
Download and view the complete annual report
Please find page 20 of the 2004 Target annual report below. You can navigate through the pages in the report by either clicking on the pages listed below, or by using the keyword search tool below to find specific information within the annual report.-
 1
1 -
2
-
3
-
4
-
5
-
6
-
7
-
8
-
9
-
 10
10 -
 11
11 -
 12
12 -
 13
13 -
 14
14 -
 15
15 -
 16
16 -
 17
17 -
 18
18 -
 19
19 -
 20
20 -
 21
21 -
 22
22 -
 23
23 -
 24
24 -
 25
25 -
 26
26 -
 27
27 -
 28
28 -
 29
29 -
 30
30 -
31
-
32
-
33
-
34
-
35
-
36
-
37
-
38
-
39
-
40
-
41
-
42
-
43
-
44
 |
 |

1818
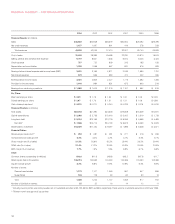
In 2004, our consolidated SG&A expense rate increased to 21.4
percent compared to 21.2 percent in 2003. Approximately half of the
year-over-year increase was attributable to a change in the method
of accounting for leases. See further discussions in the Notes to
Consolidated Financial Statements on page 32. The primary driver
of the remaining increase was higher workers’ compensation costs.
In 2003, our consolidated SG&A expense rate rose to 21.2
percent compared to 20.5 percent in 2002 primarily due to the reclas-
sification of vendor income.
In 2005, we expect our SG&A expense rate to be equal to or
increase slightly from 2004, reflecting our belief that certain expenses,
such as health care costs, will increase at a faster pace than sales.
Depreciation and Amortization
In 2004, depreciation and amortization increased 14.6 percent to
$1,259 million compared to 2003. Depreciation and amortization
expense grew faster than sales partially due to accelerated depreci-
ation on existing stores that were planned to be closed, or torn down
and rebuilt. In 2003, depreciation and amortization increased 13.6
percent to $1,098 million compared to 2002 due to new store growth.
In 2005, we expect depreciation and amortization to increase in line
with our sales growth.
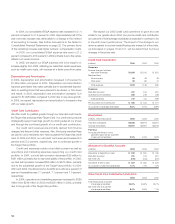
Credit Card Contribution
We offer credit to qualified guests through our branded credit cards:
the Target Visa and proprietary Target Card. Our credit card products
strategically support earnings growth by driving sales at our stores
and through the continued growth of our credit card contribution.
Our credit card revenues are primarily derived from finance
charges, late fees and other revenues. Also, third-party merchant fees
are paid to us by merchants who have accepted the Target Visa credit
card. In 2004 and 2003, our net credit card revenues increased 5.5
percent and 23.2 percent, respectively, due to continued growth in
the Target Visa portfolio.
Credit card expenses include a bad debt provision as well as
operations and marketing expenses supporting our credit card
portfolio. In 2004, our bad debt provision decreased $25 million to
$451 million, primarily due to improved quality of the portfolio. In 2003,
our bad debt provision increased $85 million to $476 million, primarily
due to the substantial growth of the Target Visa portfolio. In 2004,
2003 and 2002, the allowance for doubtful accounts as a percent of
year-end receivables was 7.1 percent, 7.1 percent and 7.0 percent,
respectively.
In 2004, operations and marketing expense increased to $286
million from $246 million in 2003 and $238 million in 2002, primarily
due to the growth of the Target Visa portfolio.
We expect our 2005 credit card operations to grow at a rate
similar to our growth rate in 2004. Our pre-tax credit card contribution
as a percent of total average receivables is expected to continue to be
in line with recent performance. The impact of the change to our
revenue related to a prime-based floating rate instead of a fixed rate,
as discussed on pages 19 and 21, will be determined by future
changes in the prime rate.
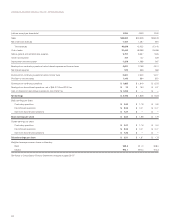
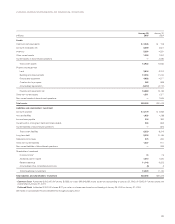
Credit Card Contribution
(millions) 2004 2003 2002
Revenues:
Finance charges, late fees
and other revenues $1,059 $1,015 $ 821
Merchant fees
Intracompany 65 49 49
Third-party 98 82 70
Total revenues 1,222 1,146 940
Expenses:
Bad debt provision 451 476 391
Operations and marketing 286 246 238
Total expenses 737 722 629
Pre-tax credit card contribution $ 485 $ 424 $ 311
As a percent of average receivables 9.8% 9.1% 8.8%
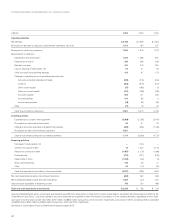
Receivables
(millions, before allowance) 2004 2003 2002
Year-end receivables $5,456 $4,973 $4,601
Average receivables $4,927 $4,661 $3,515
Past Due
Accounts with three or more
payments past due as a percent
of year-end receivables: 3.5% 4.2% 4.0%
Allowance for Doubtful Accounts
(millions) 2004 2003 2002
Allowance at beginning of year $352 $ 320 $ 180
Bad debt provision 451 476 391
Net write-offs (416) (444) (251)
Allowance at end of year $387 $ 352 $ 320
As a percent of year-end receivables 7.1% 7.1% 7.0%
Other Credit Card Contribution Information
2004 2003 2002
Total revenues as a percent
of average receivables: 24.8% 24.6% 26.7%
Net write-offs as a percent
of average receivables: 8.4% 9.5% 7.1%