Target 2004 Annual Report Download - page 19
Download and view the complete annual report
Please find page 19 of the 2004 Target annual report below. You can navigate through the pages in the report by either clicking on the pages listed below, or by using the keyword search tool below to find specific information within the annual report.-
 1
1 -
2
-
3
-
4
-
5
-
6
-
7
-
8
-
 9
9 -
 10
10 -
 11
11 -
 12
12 -
 13
13 -
 14
14 -
 15
15 -
 16
16 -
 17
17 -
 18
18 -
 19
19 -
 20
20 -
 21
21 -
 22
22 -
 23
23 -
 24
24 -
 25
25 -
 26
26 -
 27
27 -
 28
28 -
 29
29 -
30
-
31
-
32
-
33
-
34
-
35
-
36
-
37
-
38
-
39
-
40
-
41
-
42
-
43
-
44
 |
 |

1717
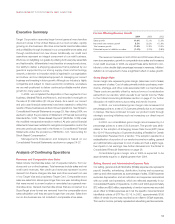
Executive Summary
Target Corporation operates large-format general merchandise
discount stores in the United States and a much smaller, rapidly
growing on-line business. We drive incremental merchandise sales
and profitability through increases in our comparable-store sales and
through contributions from new stores. Additionally, our credit card
operations represent an integral component of our retail business.
We focus on delighting our guests by offering both everyday essentials
and fashionable, differentiated merchandise at exceptional prices.
Our ability to deliver a shopping experience that is preferred by our
guests is supported by our strong supply chain and technology
network, a devotion to innovation which is ingrained in our organization
and culture, and our disciplined approach to managing our current
business and investing in future growth. Although our industry is highly
competitive and subject to macro-economic conditions, we believe
we are well-positioned to deliver continued profitable market share
growth for many years to come.
In 2004, we completed the disposition of two segments of our
business, Marshall Field’s and Mervyn’s, and recorded a total gain on
the sale of $1,999 million ($1.36 per share). As a result, our current
and prior year financial statements have been restated to reflect the
results of these businesses as discontinued operations. See Notes to
Consolidated Financial Statements on page 29. Also during 2004, we
elected to adopt the provisions of Statement of Financial Accounting
Standards No.123R, “Share-Based Payment” (SFAS No.123R) under
the modified retrospective transition method. All prior period financial
statements have been restated to recognize compensation cost in the
amounts previously reported in the Notes to Consolidated Financial
Statements under the provisions of SFAS No. 123, “Accounting for
Stock-Based Compensation.”
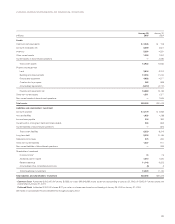
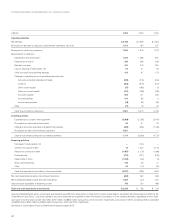
Management’s Discussion and Analysis is based on our
Consolidated Financial Statements as shown on pages 24-27.
Analysis of Continuing Operations
Revenues and Comparable-store Sales
Sales include merchandise sales, net of expected returns, from our
stores and our on-line business. Total revenues include sales and net
credit card revenues. Net credit card revenues represent income
derived from finance charges, late fees and other revenues from use
of our Target Visa and proprietary Target Card. Comparable-store
sales are sales from stores open longer than one year, including stores
that were moved to a new location or remodeled as a general mer-
chandise store. General merchandise stores that are converted to a
SuperTarget store format are removed from the comparable-store
sales calculation until they are open longer than one year. Sales from
our on-line business are not included in comparable store sales.
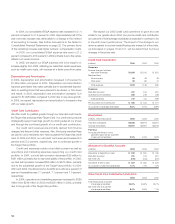
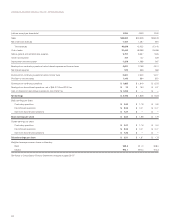
Factors Affecting Revenue Growth
2004 2003 2002
Sales growth 11.6% 12.1% 12.0%
Net credit card revenue growth 5.5% 23.2% 112.6%
Total revenue growth 11.5% 12.3% 13.3%
Estimated impact of deflation on sales (1.4%) (4.2%) (3.8%)
The revenue increases in both 2004 and 2003 were driven by
new store expansion, growth in comparable-store sales and increases
in net credit revenues. In 2005, we expect these same factors to con-
tribute to a low double digit percentage increase in revenues. Inflation/
deflation is not expected to have a significant effect on sales growth.
Gross Margin Rate
Gross margin rate represents gross margin (sales less cost of sales)
as a percent of sales. Cost of sales primarily include purchases, mark-
downs, shortage, and other costs associated with our merchandise.
These costs are partially offset by various forms of consideration
earned from our vendors, which we refer to as “vendor income.” Refer
to the Critical Accounting Estimates section on page 21 for further
discussion of retail inventory accounting and vendor income.
In 2004, our consolidated gross margin rate increased 0.6
percentage points to a rate of 31.2 percent primarily due to an increase
in markup. We have continued to lower our product costs through
strategic sourcing initiatives such as increasing our direct import
penetration.
In 2003, our consolidated gross margin rate increased by 0.4
percentage points to a rate of 30.6 percent. The growth was attrib-
utable to the adoption of Emerging Issues Task Force (EITF) Issue
No. 02-16 “Accounting by a Customer (Including a Reseller) for Certain
Consideration Received from a Vendor.” The adoption resulted in a
reclassification of a portion of our vendor income from selling, general
and administrative expenses to cost of sales and had a slight nega-
tive impact on net earnings. See further discussions in the Notes to
Consolidated Financial Statements on page 28.
Consolidated gross margin rate in 2005 is expected to be
approximately equal to or slightly greater than 2004.
Selling, General and Administrative Expense Rate
Our selling, general and administrative (SG&A) expense rate represents
payroll, benefits, advertising, distribution, buying and occupancy,
start-up and other expenses as a percentage of sales. SG&A expense
excludes depreciation and amortization and expenses associated
with our credit card operations, which are reflected separately in our
Consolidated Results of Operations. In 2004 and 2003 approximately
$72 million and $58 million, respectively, of vendor income was recorded
as an offset to SG&A expenses as it met the specific, incremental and
identifiable criteria of EITF No. 02-16. In 2002, approximately $195
million of vendor income was recorded as an offset to SG&A expenses.
This vendor income primarily represented advertising reimbursements.
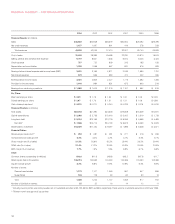
MANAGEMENT’S DISCUSSION AND ANALYSIS