Target 2013 Annual Report Download - page 2
Download and view the complete annual report
Please find page 2 of the 2013 Target annual report below. You can navigate through the pages in the report by either clicking on the pages listed below, or by using the keyword search tool below to find specific information within the annual report.-
 1
1 -
 2
2 -
 3
3 -
 4
4 -
 5
5 -
 6
6 -
 7
7 -
 8
8 -
 9
9 -
 10
10 -
 11
11 -
 12
12 -
 13
13 -
14
-
15
-
16
-
17
-
18
-
19
-
20
-
21
-
22
-
23
-
24
-
25
-
26
-
27
-
28
-
29
-
30
-
31
-
32
-
33
-
34
-
35
-
36
-
37
-
38
-
39
-
40
-
41
-
42
-
43
-
44
-
45
-
46
-
47
-
48
-
49
-
50
-
51
-
52
-
53
-
54
-
55
-
56
-
57
-
58
-
59
-
60
-
61
-
62
-
63
-
64
-
65
-
66
-
67
-
68
-
69
-
70
-
71
-
72
-
73
-
74
-
75
-
76
-
77
-
78
-
79
-
80
-
81
-
82
 |
 |

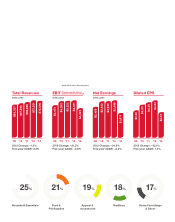
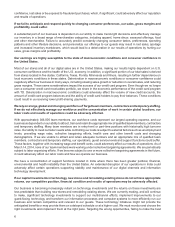
’09 ’10 ’11 ’12 ’13
$67,390
$69,865
$73,301
$72,596
Total Revenues
$65,357
IN MILLIONS
2013 Change: –1.0%
Five-year CAGR: 2.3%
(Earnings before interest
expense and income taxes)
$4,673
$5,252
$5,322
$5,371
$4,229
EBIT
IN MILLIONS
2013 Change: –21.3%
Five-year CAGR: –0.8%
’09 ’10 ’11 ’12 ’13
$2,488
$2,920
$2,929
$2,999
$1,971
Net Earnings
IN MILLIONS
2013 Change: –34.3%
Five-year CAGR: –2.3%
’09 ’10 ’11 ’12 ’13
$3.30
$4.00
$4.28
$4.52
$3.07
Diluted EPS
2013 Change: –32.1%
Five-year CAGR: 1.4%
’09 ’10 ’11 ’12 ’13
Household Essentials Food &
Pet Supplies
Apparel &
Accessories
Hardlines Home Furnishings
& Décor
25%21%19%18%17%
Total U.S. Segment Sales: $71.3 Billion
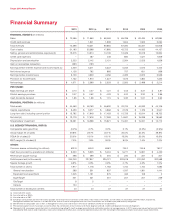
Financial Highlights (Note: 2012 was a 53-week year.)
Welcome to our 2013
AnnualReport. To explore
the key stories of the past
year and find out more
about what’s in store for the
year ahead, please visit our
online Annual Report at
Target.com/annualreport.