Target 2013 Annual Report Download - page 32
Download and view the complete annual report
Please find page 32 of the 2013 Target annual report below. You can navigate through the pages in the report by either clicking on the pages listed below, or by using the keyword search tool below to find specific information within the annual report.-
 1
1 -
2
-
3
-
4
-
5
-
6
-
7
-
8
-
9
-
10
-
11
-
12
-
13
-
14
-
15
-
16
-
17
-
18
-
19
-
20
-
21
-
 22
22 -
 23
23 -
 24
24 -
 25
25 -
 26
26 -
 27
27 -
 28
28 -
 29
29 -
 30
30 -
 31
31 -
 32
32 -
 33
33 -
 34
34 -
 35
35 -
 36
36 -
 37
37 -
 38
38 -
 39
39 -
 40
40 -
 41
41 -
 42
42 -
43
-
44
-
45
-
46
-
47
-
48
-
49
-
50
-
51
-
52
-
53
-
54
-
55
-
56
-
57
-
58
-
59
-
60
-
61
-
62
-
63
-
64
-
65
-
66
-
67
-
68
-
69
-
70
-
71
-
72
-
73
-
74
-
75
-
76
-
77
-
78
-
79
-
80
-
81
-
82
 |
 |

27
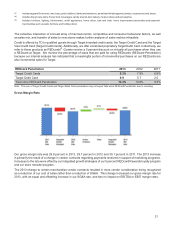
Commercial Paper
(dollars in millions) 2013 2012 2011
Maximum daily amount outstanding during the year $ 1,465 $ 970 $ 1,211
Average amount outstanding during the year 408 120 244
Amount outstanding at year-end 80 970 —
Weighted average interest rate 0.13% 0.16% 0.11%
We have additional liquidity through a committed $2.25 billion revolving credit facility obtained in October 2011, which
was amended during 2013 to extend the expiration date to October 2018. No balances were outstanding at any time
during 2013 or 2012 under this facility.
Most of our long-term debt obligations contain covenants related to secured debt levels. In addition to a secured debt
level covenant, our credit facility also contains a debt leverage covenant. We are, and expect to remain, in compliance
with these covenants. Additionally, at February 1, 2014, no notes or debentures contained provisions requiring
acceleration of payment upon a debt rating downgrade, except that certain outstanding notes allow the note holders
to put the notes to us if within a matter of months of each other we experience both (i) a change in control; and (ii) our
long-term debt ratings are either reduced and the resulting rating is non-investment grade, or our long-term debt ratings
are placed on watch for possible reduction and those ratings are subsequently reduced and the resulting rating is non-
investment grade.
We believe our sources of liquidity will continue to be adequate to maintain operations, finance anticipated expansion
and strategic initiatives, fund obligations incurred as a result of the Data Breach and any related future technology
enhancements, pay dividends and continue purchases under our share repurchase program for the foreseeable future.
We continue to anticipate ample access to commercial paper and long-term financing.
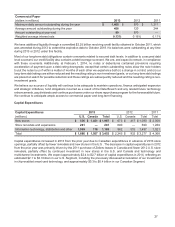
Capital Expenditures
Capital Expenditures 2013 2012 2011
(millions) U.S. Canada Total U.S. Canada Total Total
New stores $ 536 $ 1,451 $ 1,987 $ 673 $ 417 $ 1,090 $ 2,058
Store remodels and expansions 281 — 281 690 — 690 1,289
Information technology, distribution and other 1,069 116 1,185 982 515 1,497 1,021
Total $1,886 $1,567 $ 3,453 $ 2,345 $ 932 $ 3,277 $ 4,368
Capital expenditures increased in 2013 from the prior year due to Canadian expenditures in advance of 2013 store
openings, partially offset by fewer remodels and new stores in the U.S . The decrease in capital expenditures in 2012
from the prior year was primarily driven by the 2011 purchase of Zellers leases in Canada and fewer 2012 U.S. store
remodels, partially offset by continued investment in new stores in the U.S. and Canada and technology and
multichannel investments. We expect approximately $2.4 to $2.7 billion of capital expenditures in 2014, reflecting an
estimated $2.1 to $2.3 billion in our U.S. Segment, including the previously discussed acceleration of our investment
in chip-enabled smart card technology, and approximately $0.3 to $0.4 billion in our Canadian Segment.