Target 2013 Annual Report Download - page 25
Download and view the complete annual report
Please find page 25 of the 2013 Target annual report below. You can navigate through the pages in the report by either clicking on the pages listed below, or by using the keyword search tool below to find specific information within the annual report.-
 1
1 -
2
-
3
-
4
-
5
-
6
-
7
-
8
-
9
-
10
-
11
-
12
-
13
-
14
-
 15
15 -
 16
16 -
 17
17 -
 18
18 -
 19
19 -
 20
20 -
 21
21 -
 22
22 -
 23
23 -
 24
24 -
 25
25 -
 26
26 -
 27
27 -
 28
28 -
 29
29 -
 30
30 -
 31
31 -
 32
32 -
 33
33 -
 34
34 -
 35
35 -
36
-
37
-
38
-
39
-
40
-
41
-
42
-
43
-
44
-
45
-
46
-
47
-
48
-
49
-
50
-
51
-
52
-
53
-
54
-
55
-
56
-
57
-
58
-
59
-
60
-
61
-
62
-
63
-
64
-
65
-
66
-
67
-
68
-
69
-
70
-
71
-
72
-
73
-
74
-
75
-
76
-
77
-
78
-
79
-
80
-
81
-
82
 |
 |

20
U.S. Segment Rate Analysis Twelve Months Ended January 28, 2012 2012 U.S. Segment Change vs. 2011
Twelve Months
Ended
February 2,
2013 U.S. Segment,
as revised
Impact of
Historical U.S.
Credit Card
Segment(a)
Historical
U.S. Retail
Segment U.S. Segment,
as revised
Historical
U.S. Retail
Segment
Gross margin rate 29.7% 30.1% — pp 30.1%(0.4)pp (0.4)pp
SG&A expense rate 19.1 19.1 (1.0)20.1 —(1.0)
EBITDA margin rate 10.6 11.0 1.0 10.0 (0.4) 0.6
Depreciation and amortization
expense rate 2.8 3.0 — 3.0 (0.2)(0.2)
EBIT margin rate 7.8 8.0 1.0 7.0 (0.2) 0.8
Rate analysis metrics are computed by dividing the applicable amount by sales.
(a) Represents the impact of combining the historical U.S. Credit Card Segment and the U.S. Retail Segment into one U.S. Segment.
Compared with the historical U.S. Retail Segment results for the same period, segment results, as revised, reflect lower SG&A rates and
increased EBIT and EBITDA margin rates resulting from the inclusion of credit card profits, net of expenses, within SG&A compared with
historical U.S. Segment results for the same period.
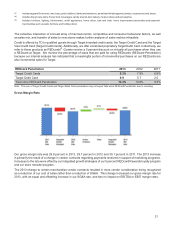
Sales
Sales include merchandise sales, net of expected returns, and gift card breakage. Refer to Note 2 of the Notes to
Consolidated Financial Statements for a definition of gift card breakage. The decrease in sales in 2013 reflects the
impact of an additional week in 2012 and a decline in comparable sales, partially offset by the contribution from new
stores. Sales growth in 2012 resulted from higher comparable sales, the contribution from new stores and a
1.7 percentage point benefit from an additional week in the fiscal year. Inflation did not materially affect sales in any
period presented.
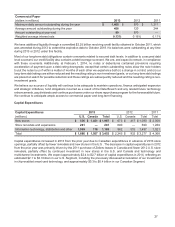
Comparable sales is a measure that highlights the performance of our existing stores and digital sales by measuring
the change in sales for a period over the comparable, prior-year period of equivalent length. The method of calculating
comparable sales varies across the retail industry. As a result, our comparable sales calculation is not necessarily
comparable to similarly titled measures reported by other companies. Comparable sales include all sales, except sales
from stores open less than thirteen months.
Comparable Sales 2013 2012 2011
Comparable sales change (0.4)% 2.7% 3.0%
Drivers of change in comparable sales:
Number of transactions (2.7)% 0.5% 0.4%
Average transaction amount 2.3 % 2.3% 2.6%
Selling price per unit 1.6 % 1.3% 0.3%
Units per transaction 0.7 % 1.0% 2.3%
U.S. Sales by Product Category Percentage of Sales
2013 2012 2011
Household essentials (a) 25% 25% 25%
Hardlines (b) 18 18 19
Apparel and accessories (c) 19 19 19
Food and pet supplies (d) 21 20 19
Home furnishings and décor (e) 17 18 18
Total 100% 100% 100%
(a) Includes pharmacy, beauty, personal care, baby care, cleaning and paper products.
(b) Includes electronics (including video game hardware and software), music, movies, books, computer software, sporting goods and toys.