Target 2013 Annual Report Download - page 50
Download and view the complete annual report
Please find page 50 of the 2013 Target annual report below. You can navigate through the pages in the report by either clicking on the pages listed below, or by using the keyword search tool below to find specific information within the annual report.-
 1
1 -
2
-
3
-
4
-
5
-
6
-
7
-
8
-
9
-
10
-
11
-
12
-
13
-
14
-
15
-
16
-
17
-
18
-
19
-
20
-
21
-
22
-
23
-
24
-
25
-
26
-
27
-
28
-
29
-
30
-
31
-
32
-
33
-
34
-
35
-
36
-
37
-
38
-
39
-
 40
40 -
 41
41 -
 42
42 -
 43
43 -
 44
44 -
 45
45 -
 46
46 -
 47
47 -
 48
48 -
 49
49 -
 50
50 -
 51
51 -
 52
52 -
 53
53 -
 54
54 -
 55
55 -
 56
56 -
 57
57 -
 58
58 -
 59
59 -
 60
60 -
61
-
62
-
63
-
64
-
65
-
66
-
67
-
68
-
69
-
70
-
71
-
72
-
73
-
74
-
75
-
76
-
77
-
78
-
79
-
80
-
81
-
82
 |
 |

45
12. Property and Equipment
Property and equipment is depreciated using the straight-line method over estimated useful lives or lease terms if
shorter. We amortize leasehold improvements purchased after the beginning of the initial lease term over the shorter
of the assets' useful lives or a term that includes the original lease term, plus any renewals that are reasonably assured
at the date the leasehold improvements are acquired. Depreciation and capital lease amortization expense for 2013,
2012 and 2011 was $2,198 million, $2,120 million and $2,107 million, respectively. For income tax purposes, accelerated
depreciation methods are generally used. Repair and maintenance costs are expensed as incurred. Facility pre-opening
costs, including supplies and payroll, are expensed as incurred.
Estimated Useful Lives Life (Years)
Buildings and improvements 8-39
Fixtures and equipment 2-15
Computer hardware and software 2-7
Long-lived assets are reviewed for impairment when events or changes in circumstances, such as a decision to relocate
or close a store or make significant software changes, indicate that the asset's carrying value may not be recoverable.
For asset groups classified as held for sale, the carrying value is compared to the fair value less cost to sell. We
estimate fair value by obtaining market appraisals, valuations from third party brokers or other valuation techniques.
Impairments of $77 million, $37 million and $43 million in 2013, 2012 and 2011, respectively, were recorded in selling,
general and administrative expenses on the Consolidated Statements of Income, primarily from completed or planned
store closures and software changes.
13. Other Noncurrent Assets
Other Noncurrent Assets
(millions) February 1,
2014 February 2,
2013
Deferred taxes $ 469 $ 206
Goodwill and intangible assets 357 224
Company-owned life insurance investments (a) 305 269
Interest rate swaps (b) 62 85
Other 409 338
Total $ 1,602 $ 1,122
(a) Company-owned life insurance policies on approximately 4,000 team members who have been designated highly compensated under the
Internal Revenue Code and have given their consent to be insured. Amounts are presented net of loans that are secured by some of these
policies.
(b) See Notes 8 and 19 for additional information relating to our interest rate swaps.
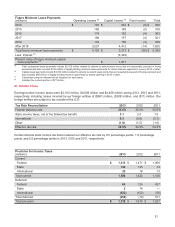
14. Goodwill and Intangible Assets
Goodwill increased to $151 million at February 1, 2014 from $59 million at February 2, 2013 due to three 2013
acquisitions. No impairments were recorded in 2013, 2012 or 2011 as a result of the goodwill impairment tests
performed.
Intangible Assets Leasehold
Acquisition Costs Other (a) Total
(millions) February 1,
2014 February 2,
2013 February 1,
2014 February 2,
2013 February 1,
2014 February 2,
2013
Gross asset $ 241 $ 237 $ 212 $ 149 $ 453 $ 386
Accumulated amortization (130)(120)(117) (101) (247) (221)
Net intangible assets $ 111 $ 117 $ 95 $ 48 $ 206 $ 165
(a) Other intangible assets relate primarily to acquired customer lists and trademarks.