Target 2013 Annual Report Download - page 67
Download and view the complete annual report
Please find page 67 of the 2013 Target annual report below. You can navigate through the pages in the report by either clicking on the pages listed below, or by using the keyword search tool below to find specific information within the annual report.-
 1
1 -
2
-
3
-
4
-
5
-
6
-
7
-
8
-
9
-
10
-
11
-
12
-
13
-
14
-
15
-
16
-
17
-
18
-
19
-
20
-
21
-
22
-
23
-
24
-
25
-
26
-
27
-
28
-
29
-
30
-
31
-
32
-
33
-
34
-
35
-
36
-
37
-
38
-
39
-
40
-
41
-
42
-
43
-
44
-
45
-
46
-
47
-
48
-
49
-
50
-
51
-
52
-
53
-
54
-
55
-
56
-
 57
57 -
 58
58 -
 59
59 -
 60
60 -
 61
61 -
 62
62 -
 63
63 -
 64
64 -
 65
65 -
 66
66 -
 67
67 -
 68
68 -
 69
69 -
 70
70 -
 71
71 -
 72
72 -
 73
73 -
 74
74 -
 75
75 -
 76
76 -
 77
77 -
78
-
79
-
80
-
81
-
82
 |
 |

62
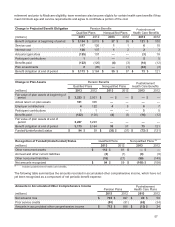
27. Accumulated Other Comprehensive Income
(millions) Cash Flow
Hedges
Currency
Translation
Adjustment
Pension and
Other
Benefit Total
February 2, 2013 $ (29) $ (15) $ (532) $ (576)
Other comprehensive (loss)/income before
reclassifications — (429) 60 (369)
Amounts reclassified from AOCI 4(a) — 50 (b) 54
February 1, 2014 $ (25) $ (444) $ (422) $ (891)
(a) Represents gains and losses on cash flow hedges, net of $2 million of taxes, which are recorded in net interest expense on the Consolidated
Statements of Operations.
(b) Represents amortization of pension and other benefit liabilities, net of $32 million of taxes, which is recorded in SG&A expenses on the
Consolidated Statements of Operations. See Note 26 for additional information.
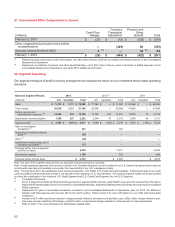
28. Segment Reporting
Our segment measure of profit is used by management to evaluate the return on our investment and to make operating
decisions.
Business Segment Results 2013 2012 (a) 2011
(millions) U.S. Canadian Total U.S. Canadian Total U.S. Canadian Total
Sales $ 71,279 $ 1,317 $72,596 $71,960 $ — $ 71,960 $68,466 $ — $ 68,466
Cost of sales 50,039 1,121 51,160 50,568 —50,568 47,860 —47,860
Selling, general and
administrative expenses (b) 14,285 910 15,196 13,759 272 14,031 13,079 74 13,153
Depreciation and amortization 1,996 227 2,223 2,044 97 2,142 2,084 48 2,131
Segment profit $4,959 $(941) $ 4,017 $5,589 $(369) $ 5,219 $5,443 $(122) $ 5,322
Gain on receivables
transaction (c) 391 152 —
Reduction of beneficial interest
asset (b) (98) — —
Other (d) (64) — —
Data Breach related costs, net of
insurance receivable (e) (17) — —
Earnings before interest expense
and income taxes 4,229 5,371 5,322
Net interest expense 1,126 762 866
Earnings before income taxes $3,103 $ 4,609 $ 4,456
Note: The sum of the segment amounts may not equal the total amounts due to rounding.
Note: Certain operating expenses are incurred on behalf of our Canadian Segment, but are included in our U.S. Segment because those costs are
not allocated internally and generally come under the responsibility of our U.S. management team.
Note: Through fiscal 2012, we operated as three business segments: U.S. Retail, U.S. Credit Card and Canadian. Following the sale of our credit
card receivables portfolio described in Note 6, we operate as two segments: U.S. and Canadian. Prior period segment results have been revised
to reflect the combination of our historical U.S. Retail Segment and U.S. Credit Card Segment into one U.S. Segment.
(a) Consisted of 53 weeks.
(b) Our U.S. Segment includes all TD profit-sharing amounts in segment profit; however, under GAAP, some amounts received from TD reduce
the beneficial interest asset and are not recorded in consolidated earnings. Segment SG&A expenses plus these amounts equal consolidated
SG&A expenses.
(c) Represents the gain on receivables transaction recorded in our Consolidated Statements of Operations, plus, for 2012, the difference
between bad debt expense and net write-offs for the fourth quarter. Refer to Note 6 for more information on our credit card receivables
transaction.
(d) Includes a $23 million workforce-reduction charge primarily related to severance and benefits costs, a $22 million charge related to part-
time team member health benefit changes, and $19 million in impairment charges related to certain parcels of undeveloped land.
(e) Refer to Note 17 for more information on Data Breach related costs.