Target 2013 Annual Report Download - page 59
Download and view the complete annual report
Please find page 59 of the 2013 Target annual report below. You can navigate through the pages in the report by either clicking on the pages listed below, or by using the keyword search tool below to find specific information within the annual report.-
 1
1 -
2
-
3
-
4
-
5
-
6
-
7
-
8
-
9
-
10
-
11
-
12
-
13
-
14
-
15
-
16
-
17
-
18
-
19
-
20
-
21
-
22
-
23
-
24
-
25
-
26
-
27
-
28
-
29
-
30
-
31
-
32
-
33
-
34
-
35
-
36
-
37
-
38
-
39
-
40
-
41
-
42
-
43
-
44
-
45
-
46
-
47
-
48
-
 49
49 -
 50
50 -
 51
51 -
 52
52 -
 53
53 -
 54
54 -
 55
55 -
 56
56 -
 57
57 -
 58
58 -
 59
59 -
 60
60 -
 61
61 -
 62
62 -
 63
63 -
 64
64 -
 65
65 -
 66
66 -
 67
67 -
 68
68 -
 69
69 -
70
-
71
-
72
-
73
-
74
-
75
-
76
-
77
-
78
-
79
-
80
-
81
-
82
 |
 |

54
Compensation expense associated with share-based awards is recognized on a straight-line basis over the shorter
of the vesting period or the minimum required service period. Total share-based compensation expense recognized
in the Consolidated Statements of Operations was $110 million, $105 million and $90 million in 2013, 2012 and 2011,
respectively. The related income tax benefit was $43 million, $42 million and $35 million in 2013, 2012 and 2011,
respectively.
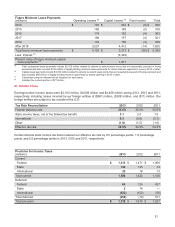
Stock Options
Through 2013, we granted nonqualified stock options to certain team members that generally vest and become
exercisable annually in equal amounts over a four-year period and expire 10 years after the grant date. We previously
granted options with a ten-year term to the non-employee members of our Board of Directors that vest immediately,
but are not exercisable until one year after the grant date. We used a Black-Scholes valuation model to estimate the
fair value of the options at the grant date.
Stock Option Activity Stock Options
Total Outstanding Exercisable
Number of
Options (a) Exercise
Price (b) Intrinsic
Value (c) Number of
Options (a) Exercise
Price (b) Intrinsic
Value (c)
February 2, 2013 34,458 $ 50.60 $ 366 21,060 $ 48.25 $ 273
Granted 226 69.56
Expired/forfeited (745)53.14
Exercised/issued (9,085)46.51
February 1, 2014 24,854 $ 52.19 $ 136 16,824 $ 50.64 $ 109
(a) In thousands.
(b) Weighted average per share.
(c) Represents stock price appreciation subsequent to the grant date, in millions.
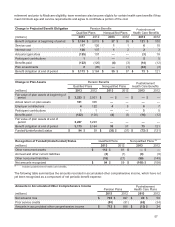
Black-Scholes Model Valuation Assumptions 2013 2012 2011
Dividend yield 2.4% 2.4% 2.5%
Volatility (a) 22% 23% 27%
Risk-free interest rate (b) 1.4% 1.0% 1.0%
Expected life in years (c) 5.5 5.5 5.5
Stock options grant date fair value $ 11.14 $ 9.70 $ 9.20
(a) Volatility represents an average of market estimates for implied volatility of Target common stock.
(b) The risk-free interest rate is an interpolation of the relevant U.S. Treasury security maturities as of each applicable grant date.
(c) The expected life is estimated based on an analysis of options already exercised and any foreseeable trends or changes in recipients'
behavior.
Stock Option Exercises
(millions) 2013 2012 2011
Cash received for exercise price $ 422 $ 331 $ 93
Intrinsic value 197 139 27
Income tax benefit 77 55 11
At February 1, 2014, there was $37 million of total unrecognized compensation expense related to nonvested stock
options, which is expected to be recognized over a weighted average period of 1.1 years. The weighted average
remaining life of exercisable options is 5.3 years, and the weighted average remaining life of all outstanding options
is 6.2 years. The total fair value of options vested was $53 million, $68 million and $75 million in 2013, 2012 and 2011,
respectively.
Performance Share Units
We issue performance share units to certain team members that represent shares potentially issuable in the future.
Issuance is based upon our performance relative to a retail peer group over a three-year performance period on certain