Target 2013 Annual Report Download - page 27
Download and view the complete annual report
Please find page 27 of the 2013 Target annual report below. You can navigate through the pages in the report by either clicking on the pages listed below, or by using the keyword search tool below to find specific information within the annual report.-
 1
1 -
2
-
3
-
4
-
5
-
6
-
7
-
8
-
9
-
10
-
11
-
12
-
13
-
14
-
15
-
16
-
 17
17 -
 18
18 -
 19
19 -
 20
20 -
 21
21 -
 22
22 -
 23
23 -
 24
24 -
 25
25 -
 26
26 -
 27
27 -
 28
28 -
 29
29 -
 30
30 -
 31
31 -
 32
32 -
 33
33 -
 34
34 -
 35
35 -
 36
36 -
 37
37 -
38
-
39
-
40
-
41
-
42
-
43
-
44
-
45
-
46
-
47
-
48
-
49
-
50
-
51
-
52
-
53
-
54
-
55
-
56
-
57
-
58
-
59
-
60
-
61
-
62
-
63
-
64
-
65
-
66
-
67
-
68
-
69
-
70
-
71
-
72
-
73
-
74
-
75
-
76
-
77
-
78
-
79
-
80
-
81
-
82
 |
 |

22
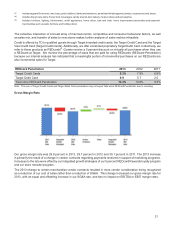
Selling, General and Administrative Expense Rate
(a) Represents revised U.S. Segment results.
Our SG&A expense rate was 20.0 percent in 2013, and 19.1 percent in both 2012 and 2011. The increase in 2013
resulted from a smaller contribution from our credit card portfolio, investments in technology and supply chain in support
of multichannel initiatives, changes in merchandise vendor contracts described on the previous page, and other
increases. Increases were partially offset by the benefit from our company-wide expense optimization efforts and
favorable incentive compensation and store hourly payroll. During 2012, investments in technology and supply chain
were offset by improvements in store hourly payroll and disciplined expense management across the Company.
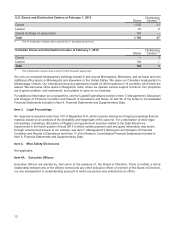
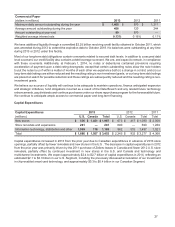
Store Data
Change in Number of Stores 2013 2012
Beginning store count 1,778 1,763
Opened 19 23
Closed (4) (5)
Relocated —(3)
Ending store count 1,793 1,778
Number of stores remodeled during the year 100 252
Number of Stores and
Retail Square Feet Number of Stores Retail Square Feet (a)
February 1,
2014 February 2,
2013 February 1,
2014 February 2,
2013
Target general merchandise stores 289 391 33,843 46,584
Expanded food assortment stores 1,245 1,131 160,891 146,249
SuperTarget stores 251 251 44,500 44,500
CityTarget stores 85820 514
Total 1,793 1,778 240,054 237,847
(a) In thousands, reflects total square feet less office, distribution center and vacant space.