Target 2013 Annual Report Download - page 24
Download and view the complete annual report
Please find page 24 of the 2013 Target annual report below. You can navigate through the pages in the report by either clicking on the pages listed below, or by using the keyword search tool below to find specific information within the annual report.-
 1
1 -
2
-
3
-
4
-
5
-
6
-
7
-
8
-
9
-
10
-
11
-
12
-
13
-
 14
14 -
 15
15 -
 16
16 -
 17
17 -
 18
18 -
 19
19 -
 20
20 -
 21
21 -
 22
22 -
 23
23 -
 24
24 -
 25
25 -
 26
26 -
 27
27 -
 28
28 -
 29
29 -
 30
30 -
 31
31 -
 32
32 -
 33
33 -
 34
34 -
35
-
36
-
37
-
38
-
39
-
40
-
41
-
42
-
43
-
44
-
45
-
46
-
47
-
48
-
49
-
50
-
51
-
52
-
53
-
54
-
55
-
56
-
57
-
58
-
59
-
60
-
61
-
62
-
63
-
64
-
65
-
66
-
67
-
68
-
69
-
70
-
71
-
72
-
73
-
74
-
75
-
76
-
77
-
78
-
79
-
80
-
81
-
82
 |
 |

19
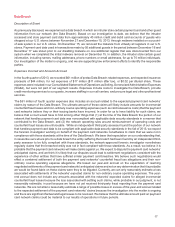
outstanding receivables at the time of closing, and a $225 million beneficial interest asset. The beneficial interest
asset effectively represents a receivable for the present value of future profit-sharing we expect to receive on the
receivables sold. Based on historical payment patterns, we estimate that the beneficial interest asset will be reduced
over a four-year period following the sale, with larger reductions in the early years. As of February 1, 2014, a $127
million beneficial interest asset remained. Concurrent with the sale of the portfolio, we repaid the nonrecourse debt
collateralized by credit card receivables (2006/2007 Series Variable Funding Certificate) at par of $1.5 billion, resulting
in net cash proceeds of $4.2 billion.
TD now underwrites, funds and owns Target Credit Card and Target Visa consumer receivables in the U.S. TD controls
risk management policies and oversees regulatory compliance, and we perform account servicing and primary
marketing functions. We earn a substantial portion of the profits generated by the Target Credit Card and Target Visa
portfolios. Income from the TD profit-sharing arrangement and our related account servicing expenses are classified
within SG&A expenses in the U.S. Segment.
Beginning with the first quarter of 2013, we no longer report a U.S. Credit Card Segment.
Analysis of Results of Operations
U.S. Segment
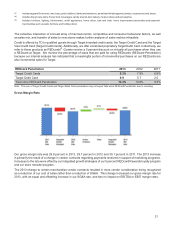
U.S. Segment Results Percent Change
(dollars in millions) 2013 2012 (a) 2011 2013/2012 2012/2011
Sales $71,279 $ 71,960 $ 68,466 (0.9)% 5.1%
Cost of sales 50,039 50,568 47,860 (1.0) 5.7
Gross margin 21,240 21,392 20,606 (0.7) 3.8
SG&A expenses (b) 14,285 13,759 13,079 3.8 5.2
EBITDA 6,955 7,633 7,527 (8.9) 1.4
Depreciation and amortization 1,996 2,044 2,084 (2.4) (1.9)
EBIT $ 4,959 $ 5,589 $ 5,443 (11.3)% 2.7%
Note: Prior period segment results have been revised to reflect the combination of our historical U.S. Retail Segment and U.S. Credit Card
Segment into one U.S. Segment. Quarterly and full-year historical information for the three most recently completed years reflecting the results
for the U.S. Segment and Canadian Segment are attached as Exhibit (99) to our current report on Form 8-K filed April 16, 2013.
Note: See Note 28 to our Consolidated Financial Statements for a reconciliation of our segment results to earnings before income taxes.
(a) Consisted of 53 weeks.
(b) SG&A includes credit card revenues and expenses for all periods presented prior to the March 2013 sale of our U.S. consumer credit
card portfolio to TD. For 2013, SG&A also includes $653 million of profit-sharing income from the arrangement with TD.
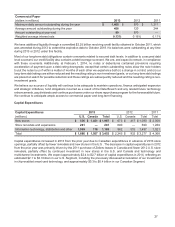
U.S. Segment Rate Analysis Twelve Months Ended February 2, 2013 2013 U.S. Segment Change vs. 2012
Twelve Months
Ended
February 1,
2014 U.S. Segment,
as revised
Impact of
Historical U.S.
Credit Card
Segment(a)
Historical
U.S. Retail
Segment U.S. Segment,
as revised
Historical
U.S. Retail
Segment
Gross margin rate 29.8% 29.7% — pp 29.7% 0.1pp 0.1pp
SG&A expense rate 20.0 19.1 (0.8)19.9 0.9 0.1
EBITDA margin rate 9.8 10.6 0.8 9.8 (0.8)—
Depreciation and amortization
expense rate 2.8 2.8 — 2.8 — —
EBIT margin rate 7.0 7.8 0.8 7.0 (0.8)—