Target 2013 Annual Report Download - page 34
Download and view the complete annual report
Please find page 34 of the 2013 Target annual report below. You can navigate through the pages in the report by either clicking on the pages listed below, or by using the keyword search tool below to find specific information within the annual report.-
 1
1 -
2
-
3
-
4
-
5
-
6
-
7
-
8
-
9
-
10
-
11
-
12
-
13
-
14
-
15
-
16
-
17
-
18
-
19
-
20
-
21
-
22
-
23
-
 24
24 -
 25
25 -
 26
26 -
 27
27 -
 28
28 -
 29
29 -
 30
30 -
 31
31 -
 32
32 -
 33
33 -
 34
34 -
 35
35 -
 36
36 -
 37
37 -
 38
38 -
 39
39 -
 40
40 -
 41
41 -
 42
42 -
 43
43 -
 44
44 -
45
-
46
-
47
-
48
-
49
-
50
-
51
-
52
-
53
-
54
-
55
-
56
-
57
-
58
-
59
-
60
-
61
-
62
-
63
-
64
-
65
-
66
-
67
-
68
-
69
-
70
-
71
-
72
-
73
-
74
-
75
-
76
-
77
-
78
-
79
-
80
-
81
-
82
 |
 |
29
and liabilities. In the Notes to Consolidated Financial Statements, we describe the significant accounting policies used
in preparing the consolidated financial statements. Our estimates are evaluated on an ongoing basis and are drawn
from historical experience and other assumptions that we believe to be reasonable under the circumstances. Actual
results could differ under other assumptions or conditions. However, we do not believe there is a reasonable likelihood
that there will be a material change in future estimates or assumptions. Our senior management has discussed the
development and selection of our critical accounting estimates with the Audit Committee of our Board of Directors.
The following items in our consolidated financial statements require significant estimation or judgment:
Inventory and cost of sales: We use the retail inventory method to account for the majority of our inventory and the
related cost of sales. Under this method, inventory is stated at cost using the last-in, first-out (LIFO) method as
determined by applying a cost-to-retail ratio to each merchandise grouping's ending retail value. The cost of our
inventory includes the amount we pay to our suppliers to acquire inventory, freight costs incurred in connection with
the delivery of product to our distribution centers and stores, and import costs, reduced by vendor income and cash
discounts. The majority of our distribution center operating costs, including compensation and benefits, are expensed
to cost of sales in the period incurred. Since inventory value is adjusted regularly to reflect market conditions, our
inventory methodology reflects the lower of cost or market. We reduce inventory for estimated losses related to shrink
and markdowns. Our shrink estimate is based on historical losses verified by physical inventory counts. Historically,
our actual physical inventory count results have shown our estimates to be reliable. Markdowns designated for clearance
activity are recorded when the salability of the merchandise has diminished. Inventory is at risk of obsolescence if
economic conditions change, including changing consumer demand, guest preferences, changing consumer credit
markets or increasing competition. We believe these risks are largely mitigated because our inventory typically turns
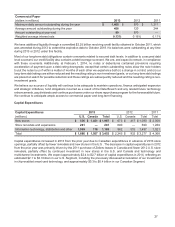
in less than three months. Inventory was $8,766 million and $7,903 million at February 1, 2014 and February 2, 2013,
respectively, and is further described in Note 10 of the Notes to Consolidated Financial Statements.
Vendor income receivable: Cost of sales and SG&A expenses are partially offset by various forms of consideration
received from our vendors. This "vendor income" is earned for a variety of vendor-sponsored programs, such as volume
rebates, markdown allowances, promotions and advertising allowances, as well as for our compliance programs. We
establish a receivable for the vendor income that is earned but not yet received. Based on the agreements in place,
this receivable is computed by estimating when we have completed our performance and when the amount is earned.
The majority of all year-end vendor income receivables are collected within the following fiscal quarter, and we do not
believe there is a reasonable likelihood that the assumptions used in our estimate will change significantly. Historically,
adjustments to our vendor income receivable have not been material. Vendor income receivable was $555 million and
$621 million at February 1, 2014 and February 2, 2013, respectively, and is described further in Note 4 of the Notes
to Consolidated Financial Statements.
Long-lived assets: Long-lived assets are reviewed for impairment whenever events or changes in circumstances
indicate that the carrying amounts may not be recoverable. The evaluation is performed at the lowest level of identifiable
cash flows independent of other assets. An impairment loss would be recognized when estimated undiscounted future
cash flows from the operation and/or disposition of the assets are less than their carrying amount. Measurement of
an impairment loss would be based on the excess of the carrying amount of the asset group over its fair value. Fair
value is measured using discounted cash flows or independent opinions of value, as appropriate. We recorded
impairments of $77 million, $37 million and $43 million in 2013, 2012 and 2011, respectively, and are described further
in Note 12. As of February 1, 2014, a 10 percent decrease in the fair value of assets we intend to sell or close would
result in additional impairment of $7 million in 2013. Historically, we have not realized material losses upon sale of
long-lived assets.
Insurance/self-insurance: We retain a substantial portion of the risk related to certain general liability, workers'
compensation, property loss and team member medical and dental claims. However, we maintain stop-loss coverage
to limit the exposure related to certain risks. Liabilities associated with these losses include estimates of both claims
filed and losses incurred but not yet reported. We use actuarial methods which consider a number of factors to estimate
our ultimate cost of losses. General liability and workers' compensation liabilities are recorded at our estimate of their
net present value; other liabilities referred to above are not discounted. Our workers' compensation and general liability
accrual was $576 million and $627 million at February 1, 2014 and February 2, 2013, respectively. We believe that
the amounts accrued are appropriate; however, our liabilities could be significantly affected if future occurrences or
loss developments differ from our assumptions. For example, a 5 percent increase or decrease in average claim costs
would impact our self-insurance expense by $28 million in 2013. Historically, adjustments to our estimates have not
been material. Refer to Item 7A, Quantitative and Qualitative Disclosures About Market Risk, for further disclosure of
the market risks associated with these exposures. We maintain insurance coverage to limit our exposure to certain
events, including network security matters. As of February 1, 2014, we have recognized a $44 million insurance-
recovery receivable relating to the Data Breach because we believe recovery is probable. However, it is possible that
the insurance carriers could dispute our claims and that we may be unable to collect the recorded receivable.