Target 2013 Annual Report Download - page 30
Download and view the complete annual report
Please find page 30 of the 2013 Target annual report below. You can navigate through the pages in the report by either clicking on the pages listed below, or by using the keyword search tool below to find specific information within the annual report.-
 1
1 -
2
-
3
-
4
-
5
-
6
-
7
-
8
-
9
-
10
-
11
-
12
-
13
-
14
-
15
-
16
-
17
-
18
-
19
-
 20
20 -
 21
21 -
 22
22 -
 23
23 -
 24
24 -
 25
25 -
 26
26 -
 27
27 -
 28
28 -
 29
29 -
 30
30 -
 31
31 -
 32
32 -
 33
33 -
 34
34 -
 35
35 -
 36
36 -
 37
37 -
 38
38 -
 39
39 -
 40
40 -
41
-
42
-
43
-
44
-
45
-
46
-
47
-
48
-
49
-
50
-
51
-
52
-
53
-
54
-
55
-
56
-
57
-
58
-
59
-
60
-
61
-
62
-
63
-
64
-
65
-
66
-
67
-
68
-
69
-
70
-
71
-
72
-
73
-
74
-
75
-
76
-
77
-
78
-
79
-
80
-
81
-
82
 |
 |

25
Reconciliation of Non-GAAP Financial Measures to GAAP Measures
To provide additional transparency, we have disclosed non-GAAP adjusted diluted earnings per share, which excludes
the impact of our 2013 Canadian market entry, the gain on receivables transaction, favorable resolution of various
income tax matters, the loss on early retirement of debt and other matters presented below. We believe this information
is useful in providing period-to-period comparisons of the results of our U.S. operations. This measure is not in
accordance with, or an alternative for, generally accepted accounting principles in the United States. The most
comparable GAAP measure is diluted earnings per share. Non-GAAP adjusted EPS should not be considered in
isolation or as a substitution for analysis of our results as reported under GAAP. Other companies may calculate non-
GAAP adjusted EPS differently than we do, limiting the usefulness of the measure for comparisons with other
companies.
2013 2012 2011
(millions, except per share data) Pretax
Net of
Tax
Per
Share
Amounts Pretax Net of
Tax
Per
Share
Amounts Pretax Net of
Tax
Per
Share
Amounts
GAAP diluted earnings per share $3.07 $4.52 $4.28
Adjustments
Total Canadian losses (a) $1,018 $ 723 $ 1.13 $ 447 $ 315 $ 0.48 $ 166 $ 119 $ 0.17
Loss on early retirement of debt 445 270 0.42 — — — 87 55 0.08
Gain on receivables transaction (b) (391)(247)(0.38)(152) (97) (0.15) — — —
Reduction of beneficial interest asset 98 61 0.09 — — — — — —
Other (c) 64 40 0.06 — — — — — —
Data Breach related costs, net of
insurance receivable (d) 17 11 0.02 — — — — — —
Resolution of income tax matters — (16) (0.03)— (58) (0.09) — (85) (0.12)
Adjusted diluted earnings per share $4.38 $4.76 $4.41
Note: A non-GAAP financial measures summary is provided on page 16. The sum of the non-GAAP adjustments may not equal the total adjustment
amounts due to rounding.
(a) Total Canadian losses include interest expense of $77 million, $78 million and $44 million for 2013, 2012 and 2011, respectively.
(b) 2013 adjustment represents consideration received in the first quarter from the sale of our U.S. credit card receivables in excess of the recorded
amount of the receivables. Consideration included a beneficial interest asset of $225 million. The 2012 adjustment represents the gain on receivables
held for sale.
(c) Other includes a $23 million workforce-reduction charge primarily related to severance and benefits costs, a $22 million charge related to part-
time team member health benefit changes and $19 million in impairment charges related to certain parcels of undeveloped land.
(d) For 2013, we recorded $61 million of pretax Data Breach-related expenses, and expected insurance proceeds of $44 million, for net pretax
expenses of $17 million.
Analysis of Financial Condition
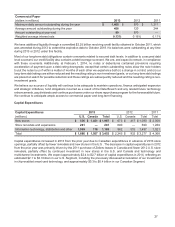
Liquidity and Capital Resources
Our period-end cash and cash equivalents balance was $695 million compared with $784 million in 2012. Short-term
investments (highly liquid investments with an original maturity of three months or less from the time of purchase) of
$3 million and $130 million were included in cash and cash equivalents at the end of 2013 and 2012, respectively. Our
investment policy is designed to preserve principal and liquidity of our short-term investments. This policy allows
investments in large money market funds or in highly rated direct short-term instruments that mature in 60 days or
less. We also place dollar limits on our investments in individual funds or instruments.
Cash Flows
Our 2013 operations were funded by both internally generated funds and proceeds from the sale of our consumer
credit card receivables portfolio. Cash flow provided by operations was $6,520 million in 2013 compared with $5,325
million in 2012. Our cash flows, combined with our prior year-end cash position, allowed us to pay current debt maturities,
invest in the business, pay dividends and repurchase shares under our share repurchase program.
Concurrent with the sale of our U.S. credit card portfolio described in Note 6 of the Notes to Consolidated Financial
Statements included in Item 8, Financial Statements and Supplementary Data, we repaid the nonrecourse debt
collateralized by credit card receivables (2006/2007 Series Variable Funding Certificate) at par of $1.5 billion. Also