Target 2013 Annual Report Download - page 3
Download and view the complete annual report
Please find page 3 of the 2013 Target annual report below. You can navigate through the pages in the report by either clicking on the pages listed below, or by using the keyword search tool below to find specific information within the annual report.-
 1
1 -
 2
2 -
 3
3 -
 4
4 -
 5
5 -
 6
6 -
 7
7 -
 8
8 -
 9
9 -
 10
10 -
 11
11 -
 12
12 -
 13
13 -
 14
14 -
15
-
16
-
17
-
18
-
19
-
20
-
21
-
22
-
23
-
24
-
25
-
26
-
27
-
28
-
29
-
30
-
31
-
32
-
33
-
34
-
35
-
36
-
37
-
38
-
39
-
40
-
41
-
42
-
43
-
44
-
45
-
46
-
47
-
48
-
49
-
50
-
51
-
52
-
53
-
54
-
55
-
56
-
57
-
58
-
59
-
60
-
61
-
62
-
63
-
64
-
65
-
66
-
67
-
68
-
69
-
70
-
71
-
72
-
73
-
74
-
75
-
76
-
77
-
78
-
79
-
80
-
81
-
82
 |
 |

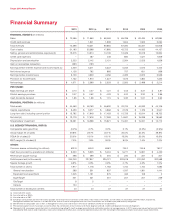
2013 2012 (a) 2011 2010 2009 2008
FINANCIAL RESULTS:(in millions)
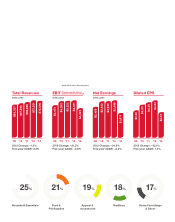
Sales $ 72,596 $ 71,960 $ 68,466 $ 65,786 $ 63,435 $ 62,884
Credit card revenues – 1,341 1,399 1,604 1,922 2,064
Total revenues 72,596 73,301 69,865 67,390 65,357 64,948
Cost of sales 51,160 50,568 47,860 45,725 44,062 44,157
Selling, general and administrative expenses(b) 15,375 14,914 14,106 13,469 13,078 12,954
Credit card expenses – 467 446 860 1,521 1,609
Depreciation and amortization 2,223 2,142 2,131 2,084 2,023 1,826
Gain on receivables transaction (391 (161 – – – –
Earnings before interest expense and income taxes(c) 4,229 5,371 5,322 5,252 4,673 4,402
Net interest expense 1,126 762 866 757 801 866
Earnings before income taxes 3,103 4,609 4,456 4,495 3,872 3,536
Provision for income taxes 1,132 1,610 1,527 1,575 1,384 1,322
Net earnings $ 1,971 $ 2,999 $ 2,929 $ 2,920 $ 2,488 $ 2,214
PER SHARE:
Basic earnings per share $ 3.10 $ 4.57 $ 4.31 $ 4.03 $ 3.31 $ 2.87
Diluted earnings per share $ 3.07 $ 4.52 $ 4.28 $ 4.00 $ 3.30 $ 2.86
Cash dividends declared $ 1.65 $ 1.38 $ 1.15 $ 0.92 $ 0.67 $ 0.62
FINANCIAL POSITION:(in millions)
Total assets $ 44,553 $ 48,163 $ 46,630 $ 43,705 $ 44,533 $ 44,106
Capital expenditures $ 3,453 $ 3,277 $ 4,368 $ 2,129 $ 1,729 $ 3,547
Long‑term debt, including current portion $ 13,782 $ 17,648 $ 17,483 $ 15,726 $ 16,814 $ 18,752
Net debt(d) $ 13,779 $ 17,518 $ 17,289 $ 14,597 $ 15,288 $ 18,562
Shareholders’ investment $ 16,231 $ 16,558 $ 15,821 $ 15,487 $ 15,347 $ 13,712
U.S. SEGMENT FINANCIAL RATIOS:
Comparable sales growth(e) (0.4%) 2.7% 3.0% 2.1% (2.5%) (2.9%)
Gross margin (% of sales) 29.8% 29.7% 30.1% 30.5% 30.5% 29.8%
SG&A (% of sales)(f) 20.0% 19.1% 19.1% 19.3% 20.0% 19.9%
EBIT margin (% of sales) (f) 7.0% 7.8% 8.0% 8.0% 7.4% 7.0%
OTHER:
Common shares outstanding (in millions) 632.9 645.3 669.3 704.0 744.6 752.7
Cash ow provided by operations (in millions) $ 6,520 $ 5,325 $ 5,434 $ 5,271 $ 5,881 $ 4,430
Revenue per square foot(g) $ 298 $ 299 $ 294 $ 290 $ 287 $ 301
Retail square feet (in thousands) 254,243 237,847 235,721 233,618 231,952 222,588
Square footage growth 6.9% 0.9% 0.9% 0.7% 4.2% 7.0%
Total number of stores 1,917 1,778 1,763 1,750 1,740 1,682
General merchandise 289 391 637 1,037 1,381 1,441
Expanded food assortment 1,245 1,131 875 462 108 2
SuperTarget 251 251 251 251 251 239
CityTarget 8 5 – – – –
Canada 124 – – – – –
Total number of distribution centers 40 40 37 37 37 34
Financial Summary
Target 2013 Annual Report
(a) Consisted of 53 weeks.
(b) Also referred to as SG&A.
(c) Also referred to as EBIT.
(d) Including current portion and short‑term notes payable, net of short‑term investments of $3 million, $130 million, $194 million, $1,129 million, $1,526 million and $190 million, respectively.
Management believes this measure is an indicator of our level of nancial leverage because short‑term investments are available to pay debt maturity obligations.
(e) See denition of comparable sales in Item 7, Management’s Discussion and Analysis of Financial Condition and Results of Operations.
(f) Prior period segment results have been revised to reect the combination of our historical U.S. Retail Segment and U.S. Credit Card Segment into one U.S. Segment.
(g) Represents U.S. revenue per square foot which is calculated using rolling 13 month average square feet and a rolling four quarters of average revenue. In 2012, revenue per square foot was calculated
excluding the 53rd week in order to provide a more useful comparison to other years. Using total reported revenues for 2012 (including the 53rd week) resulted in revenue per square foot of $304.
))