Target 2013 Annual Report Download - page 46
Download and view the complete annual report
Please find page 46 of the 2013 Target annual report below. You can navigate through the pages in the report by either clicking on the pages listed below, or by using the keyword search tool below to find specific information within the annual report.-
 1
1 -
2
-
3
-
4
-
5
-
6
-
7
-
8
-
9
-
10
-
11
-
12
-
13
-
14
-
15
-
16
-
17
-
18
-
19
-
20
-
21
-
22
-
23
-
24
-
25
-
26
-
27
-
28
-
29
-
30
-
31
-
32
-
33
-
34
-
35
-
 36
36 -
 37
37 -
 38
38 -
 39
39 -
 40
40 -
 41
41 -
 42
42 -
 43
43 -
 44
44 -
 45
45 -
 46
46 -
 47
47 -
 48
48 -
 49
49 -
 50
50 -
 51
51 -
 52
52 -
 53
53 -
 54
54 -
 55
55 -
 56
56 -
57
-
58
-
59
-
60
-
61
-
62
-
63
-
64
-
65
-
66
-
67
-
68
-
69
-
70
-
71
-
72
-
73
-
74
-
75
-
76
-
77
-
78
-
79
-
80
-
81
-
82
 |
 |

41
3. Cost of Sales and Selling, General and Administrative Expenses
The following table illustrates the primary items classified in each major expense category:
Cost of Sales Selling, General and Administrative Expenses
Total cost of products sold including
• Freight expenses associated with moving
merchandise from our vendors to our
distribution centers and our retail stores, and
among our distribution and retail facilities
• Vendor income that is not reimbursement of
specific, incremental and identifiable costs
Inventory shrink
Markdowns
Outbound shipping and handling expenses
associated with sales to our guests
Payment term cash discounts
Distribution center costs, including compensation
and benefits costs
Import costs
Compensation and benefit costs including
• Stores
• Headquarters
Occupancy and operating costs of retail and
headquarters facilities
Advertising, offset by vendor income that is a
reimbursement of specific, incremental and
identifiable costs
Pre-opening costs of stores and other facilities
U.S. credit cards servicing expenses and profit
sharing
Litigation and defense costs and related insurance
recovery
Other administrative costs
Note: The classification of these expenses varies across the retail industry.
4. Consideration Received from Vendors
We receive consideration for a variety of vendor-sponsored programs, such as volume rebates, markdown allowances,
promotions and advertising allowances and for our compliance programs, referred to as "vendor income." Vendor
income reduces either our inventory costs or SG&A expenses based on the provisions of the arrangement. Under our
compliance programs, vendors are charged for merchandise shipments that do not meet our requirements (violations),
such as late or incomplete shipments. These allowances are recorded when violations occur. Substantially all
consideration received is recorded as a reduction of cost of sales.
We establish a receivable for vendor income that is earned but not yet received. Based on provisions of the agreements
in place, this receivable is computed by estimating the amount earned when we have completed our performance.
We perform detailed analyses to determine the appropriate level of the receivable in the aggregate. The majority of
year-end receivables associated with these activities are collected within the following fiscal quarter. We have not
historically had significant write-offs for these receivables.
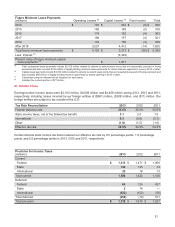
5. Advertising Costs
Advertising costs, which primarily consist of newspaper circulars, internet advertisements and media broadcast, are
expensed at first showing or distribution of the advertisement, and are recorded net of related vendor income.
Advertising Costs
(millions) 2013 2012 2011
Gross advertising costs $ 1,744 $ 1,653 $ 1,589
Vendor income (a) 76 231 229
Net advertising costs $ 1,668 $ 1,422 $ 1,360
(a) A 2013 change to certain merchandise vendor contracts resulted in more vendor funding being recognized as a reduction of our cost of
sales rather than offsetting certain advertising expenses.
6. Credit Card Receivables Transaction
In March 2013, we sold our entire U.S. consumer credit card portfolio to TD and recognized a gain of $391 million.
This transaction was accounted for as a sale, and the receivables are no longer reported in our Consolidated Statements
of Financial Position. Consideration received included cash of $5.7 billion, equal to the gross (par) value of the
outstanding receivables at the time of closing, and a $225 million beneficial interest asset. Concurrent with the sale
of the portfolio, we repaid the nonrecourse debt collateralized by credit card receivables (2006/2007 Series Variable
Funding Certificate) at par of $1.5 billion, resulting in net cash proceeds of $4.2 billion.