Target 2013 Annual Report Download - page 49
Download and view the complete annual report
Please find page 49 of the 2013 Target annual report below. You can navigate through the pages in the report by either clicking on the pages listed below, or by using the keyword search tool below to find specific information within the annual report.-
 1
1 -
2
-
3
-
4
-
5
-
6
-
7
-
8
-
9
-
10
-
11
-
12
-
13
-
14
-
15
-
16
-
17
-
18
-
19
-
20
-
21
-
22
-
23
-
24
-
25
-
26
-
27
-
28
-
29
-
30
-
31
-
32
-
33
-
34
-
35
-
36
-
37
-
38
-
 39
39 -
 40
40 -
 41
41 -
 42
42 -
 43
43 -
 44
44 -
 45
45 -
 46
46 -
 47
47 -
 48
48 -
 49
49 -
 50
50 -
 51
51 -
 52
52 -
 53
53 -
 54
54 -
 55
55 -
 56
56 -
 57
57 -
 58
58 -
 59
59 -
60
-
61
-
62
-
63
-
64
-
65
-
66
-
67
-
68
-
69
-
70
-
71
-
72
-
73
-
74
-
75
-
76
-
77
-
78
-
79
-
80
-
81
-
82
 |
 |

44
As of February 2, 2013, our consumer credit card receivables were recorded at the lower of cost (par) or fair value
because they were classified as held for sale. We estimated the fair value of our consumer credit card portfolio to be
approximately $6.3 billion using a cash flow-based, economic-profit model using Level 3 inputs, including the forecasted
performance of the portfolio and a market-based discount rate. We used internal data to forecast expected payment
patterns and write-offs, revenue, and operating expenses (credit EBIT yield) related to the credit card portfolio. Refer
to Note 6 for more information on our credit card receivables transaction.
The carrying amounts of accounts payable and certain accrued and other current liabilities approximate fair value due
to their short terms.
9. Cash Equivalents
Cash equivalents include highly liquid investments with an original maturity of three months or less from the time of
purchase. These investments were $3 million and $130 million at February 1, 2014 and February 2, 2013, respectively.
Cash equivalents also include amounts due from third-party financial institutions for credit and debit card transactions.
These receivables typically settle in less than five days and were $347 million and $371 million at February 1, 2014
and February 2, 2013, respectively.
10. Inventory
The majority of our inventory is accounted for under the retail inventory accounting method (RIM) using the last-in,
first-out (LIFO) method. Inventory is stated at the lower of LIFO cost or market. The cost of our inventory includes the
amount we pay to our suppliers to acquire inventory, freight costs incurred in connection with the delivery of product
to our distribution centers and stores, and import costs, reduced by vendor income and cash discounts. The majority
of our distribution center operating costs, including compensation and benefits, are expensed in the period incurred.
Inventory is also reduced for estimated losses related to shrink and markdowns. The LIFO provision is calculated
based on inventory levels, markup rates and internally measured retail price indices.
Under RIM, inventory cost and the resulting gross margins are calculated by applying a cost-to-retail ratio to the
inventory retail value. RIM is an averaging method that has been widely used in the retail industry due to its practicality.
The use of RIM will result in inventory being valued at the lower of cost or market because permanent markdowns are
taken as a reduction of the retail value of inventory.
Certain other inventory is recorded at the lower of cost or market using the cost method. The valuation allowance for
inventory valued under a cost method was not material to our Consolidated Financial Statements as of the end of
fiscal 2013 or 2012.
We routinely enter into arrangements with vendors whereby we do not purchase or pay for merchandise until the
merchandise is ultimately sold to a guest. Activity under this program is included in sales and cost of sales in the
Consolidated Statements of Operations, but the merchandise received under the program is not included in inventory
in our Consolidated Statements of Financial Position because of the virtually simultaneous purchase and sale of this
inventory. Sales made under these arrangements totaled $1,833 million, $1,800 million and $1,736 million in 2013,
2012 and 2011, respectively.
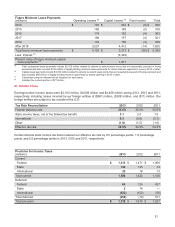
11. Other Current Assets
Other Current Assets
(millions) February 1,
2014 February 2,
2013
Pharmacy, income tax and other receivables $ 792 $ 478
Vendor income receivable 555 621
Prepaid expenses 272 310
Deferred taxes 177 193
Other 316 258
Total $ 2,112 $ 1,860