Target 2013 Annual Report Download - page 48
Download and view the complete annual report
Please find page 48 of the 2013 Target annual report below. You can navigate through the pages in the report by either clicking on the pages listed below, or by using the keyword search tool below to find specific information within the annual report.-
 1
1 -
2
-
3
-
4
-
5
-
6
-
7
-
8
-
9
-
10
-
11
-
12
-
13
-
14
-
15
-
16
-
17
-
18
-
19
-
20
-
21
-
22
-
23
-
24
-
25
-
26
-
27
-
28
-
29
-
30
-
31
-
32
-
33
-
34
-
35
-
36
-
37
-
 38
38 -
 39
39 -
 40
40 -
 41
41 -
 42
42 -
 43
43 -
 44
44 -
 45
45 -
 46
46 -
 47
47 -
 48
48 -
 49
49 -
 50
50 -
 51
51 -
 52
52 -
 53
53 -
 54
54 -
 55
55 -
 56
56 -
 57
57 -
 58
58 -
59
-
60
-
61
-
62
-
63
-
64
-
65
-
66
-
67
-
68
-
69
-
70
-
71
-
72
-
73
-
74
-
75
-
76
-
77
-
78
-
79
-
80
-
81
-
82
 |
 |

43
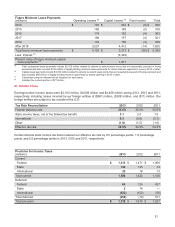
Fair Value Measurements –
Recurring Basis Fair Value at February 1, 2014 Fair Value at February 2, 2013
(millions) Level 1 Level 2 Level 3 Level 1 Level 2 Level 3
Assets
Cash and cash equivalents
Short-term investments $3$ — $ — $ 130 $ — $ —
Other current assets
Interest rate swaps (a) — 1 —— 4 —
Prepaid forward contracts 73 — — 73 — —
Beneficial interest asset (b) —— 71 ———
Other noncurrent assets
Interest rate swaps (a) —62 — — 85 —
Company-owned life insurance
investments (c) —305 — — 269 —
Beneficial interest asset (b) —— 56 ———
Total $76 $ 368 $ 127 $ 203 $ 358 $ —
Liabilities
Other current liabilities
Interest rate swaps (a) $—$ — $ — $ — $ 2 $ —
Other noncurrent liabilities
Interest rate swaps (a) $—$ 39 $ — $ — $ 54 $ —
Total $—$ 39 $ — $ — $ 56 $ —
(a) There was one interest rate swap designated as an accounting hedge at February 1, 2014 and February 2, 2013. See Note 19 for additional
information on interest rate swaps.
(b) A rollforward of the Level 3 beneficial interest asset is included in Note 6.
(c) Company-owned life insurance investments consist of equity index funds and fixed income assets. Amounts are presented net of nonrecourse
loans that are secured by some of these policies. These loan amounts were $790 million at February 1, 2014 and $817 million at February 2,
2013.
Valuation Technique
Short-term investments - Carrying value approximates fair value because maturities are less than three months.
Prepaid forward contracts - Initially valued at transaction price. Subsequently valued by reference to the market price
of Target common stock.
Interest rate swaps - Valuation models are calibrated to initial trade price. Subsequent valuations are based on
observable inputs to the valuation model (e.g., interest rates and credit spreads).
Company-owned life insurance investments - Includes investments in separate accounts that are valued based on
market rates credited by the insurer.
Beneficial interest asset - Valued using a cash-flow based economic-profit model, which includes inputs of the
forecasted performance of the receivables portfolio and a market-based discount rate. Internal data is used to
forecast expected payment patterns and write-offs, revenue, and operating expenses (credit EBIT yield) related to
the credit card portfolio. Changes in macroeconomic conditions in the United States could affect the estimated fair
value. A one percentage point change in the forecasted EBIT yield would impact our fair value estimate by
approximately $20 million. A one percentage point change in the forecasted discount rate would impact our fair
value estimate by approximately $4 million. As described in Note 6, this beneficial interest asset effectively
represents a receivable for the present value of future profit-sharing we expect to receive on the receivables sold.
As a result, a portion of the profit-sharing payments we receive from TD will reduce the beneficial interest asset.
As the asset is reduced over time, changes in the forecasted credit EBIT yield and the forecasted discount rate
will have a similar impact on the estimated fair value.
The carrying amount and estimated fair value of debt, a significant financial instrument not measured at fair value in
the Consolidated Statements of Financial Position, was $11,758 million and $13,184 million, respectively, at February
1, 2014, and $15,618 million and $18,143 million, respectively, at February 2, 2013. The fair value of debt is generally
measured using a discounted cash flow analysis based on current market interest rates for similar types of financial
instruments and would be classified as Level 2. These amounts exclude unamortized swap valuation adjustments and
capital lease obligations.