Target 2013 Annual Report Download - page 21
Download and view the complete annual report
Please find page 21 of the 2013 Target annual report below. You can navigate through the pages in the report by either clicking on the pages listed below, or by using the keyword search tool below to find specific information within the annual report.-
 1
1 -
2
-
3
-
4
-
5
-
6
-
7
-
8
-
9
-
10
-
 11
11 -
 12
12 -
 13
13 -
 14
14 -
 15
15 -
 16
16 -
 17
17 -
 18
18 -
 19
19 -
 20
20 -
 21
21 -
 22
22 -
 23
23 -
 24
24 -
 25
25 -
 26
26 -
 27
27 -
 28
28 -
 29
29 -
 30
30 -
 31
31 -
32
-
33
-
34
-
35
-
36
-
37
-
38
-
39
-
40
-
41
-
42
-
43
-
44
-
45
-
46
-
47
-
48
-
49
-
50
-
51
-
52
-
53
-
54
-
55
-
56
-
57
-
58
-
59
-
60
-
61
-
62
-
63
-
64
-
65
-
66
-
67
-
68
-
69
-
70
-
71
-
72
-
73
-
74
-
75
-
76
-
77
-
78
-
79
-
80
-
81
-
82
 |
 |

16
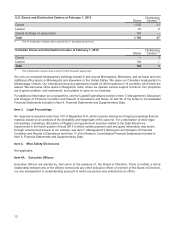
Item 6. Selected Financial Data
As of or for the Year Ended
(millions, except per share data) 2013 2012 (a) 2011 2010 2009 2008
Financial Results:
Total revenues (b) $72,596 $73,301 $ 69,865 $ 67,390 $ 65,357 $ 64,948
Net earnings 1,971 2,999 2,929 2,920 2,488 2,214
Per Share:
Basic earnings per share 3.10 4.57 4.31 4.03 3.31 2.87
Diluted earnings per share 3.07 4.52 4.28 4.00 3.30 2.86
Cash dividends declared per share 1.65 1.38 1.15 0.92 0.67 0.62
Financial Position:
Total assets 44,553 48,163 46,630 43,705 44,533 44,106
Long-term debt, including current portion 13,782 17,648 17,483 15,726 16,814 18,752
Note: This information should be read in conjunction with Management’s Discussion and Analysis of Financial Condition and Results of
Operations, included in Item 7 of this Report, and our consolidated financial statements and notes thereto, included in Item 8 of this Report.
(a) Consisted of 53 weeks.
(b) For 2013, total revenues include sales generated by our U.S. and Canadian retail operations. For 2012 and prior, total revenues include
sales generated by our U.S. retail operations and credit card revenues.
Item 7. Management's Discussion and Analysis of Financial Condition and Results of Operations
Executive Summary
Fiscal 2013 included the following notable items:
• GAAP earnings per share were $3.07, including dilution of $1.13 related to the Canadian Segment.
• Adjusted earnings per share were $4.38 on a comparable sales decrease of 0.4 percent.
• We paid dividends of $1,006 million and repurchased 21.9 million of our shares for $1,474 million.
• We opened 124 stores in Canada, marking the biggest single-year store opening cycle in the Company's history
and first year of international retail operations.
• We completed the sale of our U.S. consumer credit card portfolio to TD in March 2013 and recognized a gain of
$391 million.
• We used $1.4 billion of the net proceeds received from the sale of our U.S. consumer credit card portfolio to
repurchase, at market value, $970 million of debt.
Sales were $72,596 million for 2013, an increase of $636 million or 0.9 percent from the prior year. Consolidated
earnings before interest expense and income taxes for 2013 decreased by $1,142 million or 21.3 percent from 2012
to $4,229 million. Cash flow provided by operations was $6,520 million, $5,325 million and $5,434 million for 2013,
2012 and 2011, respectively. In connection with the sale of our U.S. credit card receivables, we received cash of $5.7
billion. Of this amount, $2.7 billion is included in cash flow provided by operations and $3.0 billion is included in cash
flow provided by investing activities.
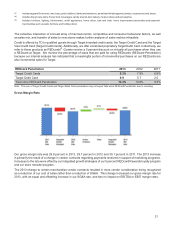
Earnings Per Share Percent Change
2013 2012 (a) 2011 2013/2012 2012/2011
GAAP diluted earnings per share $3.07 $ 4.52 $ 4.28 (32.1)% 5.6%
Adjustments 1.31 0.24 0.13
Adjusted diluted earnings per share $4.38 $ 4.76 $ 4.41 (8.0)% 7.9%
Note: We have disclosed adjusted diluted earnings per share ("Adjusted EPS"), a non-GAAP metric, which excludes the impact of certain matters
not related to our routine retail operations, including the impact of our Canadian market entry. Management believes that Adjusted EPS is meaningful
in order to provide period-to-period comparisons of our operating results. A reconciliation of non-GAAP financial measures to GAAP measures is
provided on page 25.
(a) Consisted of 53 weeks.