Target 2013 Annual Report Download - page 31
Download and view the complete annual report
Please find page 31 of the 2013 Target annual report below. You can navigate through the pages in the report by either clicking on the pages listed below, or by using the keyword search tool below to find specific information within the annual report.-
 1
1 -
2
-
3
-
4
-
5
-
6
-
7
-
8
-
9
-
10
-
11
-
12
-
13
-
14
-
15
-
16
-
17
-
18
-
19
-
20
-
 21
21 -
 22
22 -
 23
23 -
 24
24 -
 25
25 -
 26
26 -
 27
27 -
 28
28 -
 29
29 -
 30
30 -
 31
31 -
 32
32 -
 33
33 -
 34
34 -
 35
35 -
 36
36 -
 37
37 -
 38
38 -
 39
39 -
 40
40 -
 41
41 -
42
-
43
-
44
-
45
-
46
-
47
-
48
-
49
-
50
-
51
-
52
-
53
-
54
-
55
-
56
-
57
-
58
-
59
-
60
-
61
-
62
-
63
-
64
-
65
-
66
-
67
-
68
-
69
-
70
-
71
-
72
-
73
-
74
-
75
-
76
-
77
-
78
-
79
-
80
-
81
-
82
 |
 |

26
during the first quarter of 2013, we used $1.4 billion of the net proceeds received from the sale to repurchase, at market
value, $970 million of debt. We have applied additional proceeds from the sale to reduce our debt and repurchase
shares.
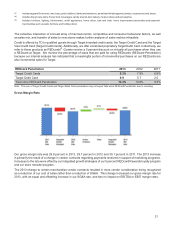
Year-end inventory levels increased from $7,903 million in 2012 to $8,766 million in 2013, about half of which was for
our 2013 Canadian market entry. Accounts payable increased by $627 million, or 8.9 percent over the same period.
Share Repurchases
During the first quarter of 2012, we completed a $10 billion share repurchase program authorized by our Board of
Directors in November 2007, and began repurchasing shares under a new $5 billion program authorized by our Board
of Directors in January 2012. During 2013, we repurchased 21.9 million shares of our common stock for a total
investment of $1,474 million ($67.41 per share). We did not repurchase any shares during the second half of 2013
due to our performance and desire to maintain our strong investment grade credit ratings. During 2012, we repurchased
32.2 million shares of our common stock for a total investment of $1,900 million ($58.96 per share).
Dividends
We paid dividends totaling $1,006 million in 2013 and $869 million in 2012, for an increase of 15.8 percent. We declared
dividends totaling $1,051 million ($1.65 per share) in 2013, for an increase of 16.4 percent over 2012. We declared
dividends totaling $903 million ($1.38 per share) in 2012, an increase of 16.2 percent over 2011. We have paid dividends
every quarter since our 1967 initial public offering, and it is our intent to continue to do so in the future.
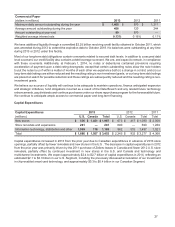
Short-term and Long-term Financing
Our financing strategy is to ensure liquidity and access to capital markets, to manage our net exposure to floating
interest rate volatility and to maintain a balanced spectrum of debt maturities. Within these parameters, we seek to
minimize our borrowing costs. Our ability to access the long-term debt and commercial paper markets has provided
us with ample sources of liquidity. Our continued access to these markets depends on multiple factors, including the
condition of debt capital markets, our operating performance and maintaining strong debt ratings. As of February 1,
2014, our credit ratings were as follows:
Credit Ratings Moody's Standard and Poor's Fitch
Long-term debt A2 A+ A-
Commercial paper P-1 A-1 F2
If our credit ratings were lowered, our ability to access the debt markets, our cost of funds and other terms for new
debt issuances could be adversely impacted. Each credit rating agency reviews its rating periodically and there is no
guarantee our current credit ratings will remain the same as described above. Our Standard and Poor’s rating currently
carries a negative outlook, and we believe that our recent operating performance may cause Standard and Poor’s to
lower their long-term debt rating by one level.
As a measure of our financial condition, we monitor our interest coverage ratio, representing the ratio of pretax earnings
before fixed charges to fixed charges. Fixed charges include interest expense and the interest portion of rent expense.
Our interest coverage ratio was 4.7x in 2013, 6.1x in 2012 and 5.9x in 2011. Refer to Exhibit (12) for a description of
how the gain on sale of our U.S. credit card receivable portfolio and loss on early retirement of debt affected the 2013
calculation.
In 2013, we funded our peak sales season working capital needs through internally generated funds and the issuance
of commercial paper. In 2012, we funded our peak sales season working capital needs through internally generated
funds.