Target 2013 Annual Report Download - page 56
Download and view the complete annual report
Please find page 56 of the 2013 Target annual report below. You can navigate through the pages in the report by either clicking on the pages listed below, or by using the keyword search tool below to find specific information within the annual report.-
 1
1 -
2
-
3
-
4
-
5
-
6
-
7
-
8
-
9
-
10
-
11
-
12
-
13
-
14
-
15
-
16
-
17
-
18
-
19
-
20
-
21
-
22
-
23
-
24
-
25
-
26
-
27
-
28
-
29
-
30
-
31
-
32
-
33
-
34
-
35
-
36
-
37
-
38
-
39
-
40
-
41
-
42
-
43
-
44
-
45
-
 46
46 -
 47
47 -
 48
48 -
 49
49 -
 50
50 -
 51
51 -
 52
52 -
 53
53 -
 54
54 -
 55
55 -
 56
56 -
 57
57 -
 58
58 -
 59
59 -
 60
60 -
 61
61 -
 62
62 -
 63
63 -
 64
64 -
 65
65 -
 66
66 -
67
-
68
-
69
-
70
-
71
-
72
-
73
-
74
-
75
-
76
-
77
-
78
-
79
-
80
-
81
-
82
 |
 |

51
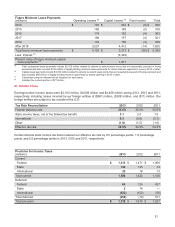
Future Minimum Lease Payments
(millions) Operating Leases (a) Capital Leases (b) Rent Income Total
2014 $ 187 $ 204 $ (6) $ 385
2015 185 198 (5) 378
2016 174 192 (4) 362
2017 168 157 (4) 321
2018 162 150 (3) 309
After 2018 3,227 4,412 (14) 7,625
Total future minimum lease payments $ 4,103 $ 5,313 $ (36) $ 9,380
Less: Interest (c) (3,342)
Present value of future minimum capital
lease payments (d) $ 1,971
(a) Total contractual lease payments include $2,105 million related to options to extend lease terms that are reasonably assured of being
exercised and also includes $135 million of legally binding minimum lease payments for stores that are expected to open in 2014 or later.
(b) Capital lease payments include $3,740 million related to options to extend lease terms that are reasonably assured of being exercised and
also includes $80 million of legally binding minimum payments for stores opening in 2014 or later.
(c) Calculated using the interest rate at inception for each lease.
(d) Includes the current portion of $77 million.
21. Income Taxes
Earnings before income taxes were $3,103 million, $4,609 million and $4,456 million during 2013, 2012 and 2011,
respectively, including losses incurred by our foreign entities of ($881) million, ($309) million, and ($11) million. Our
foreign entities are subject to tax outside of the U.S.
Tax Rate Reconciliation 2013 2012 2011
Federal statutory rate 35.0% 35.0% 35.0%
State income taxes, net of the federal tax benefit 3.1 2.0 1.0
International 0.3 (0.6) (0.7)
Other (1.9) (1.5) (1.0)
Effective tax rate 36.5% 34.9% 34.3%
Certain discrete state income tax items reduced our effective tax rate by 0.5 percentage points, 1.0 percentage
points, and 2.0 percentage points in 2013, 2012 and 2011, respectively.
Provision for Income Taxes
(millions) 2013 2012 2011
Current:
Federal $ 1,213 $ 1,471 $ 1,069
State 148 135 74
International 25 18 13
Total current 1,386 1,624 1,156
Deferred:
Federal 66 124 427
State 214 —
International (322) (152) (56)
Total deferred (254) (14) 371
Total provision $ 1,132 $ 1,610 $ 1,527