Walmart 2007 Annual Report Download - page 2
Download and view the complete annual report
Please find page 2 of the 2007 Walmart annual report below. You can navigate through the pages in the report by either clicking on the pages listed below, or by using the keyword search tool below to find specific information within the annual report.-
 1
1 -
 2
2 -
 3
3 -
 4
4 -
 5
5 -
 6
6 -
 7
7 -
 8
8 -
 9
9 -
 10
10 -
 11
11 -
 12
12 -
 13
13 -
14
-
15
-
16
-
17
-
18
-
19
-
20
-
21
-
22
-
23
-
24
-
25
-
26
-
27
-
28
-
29
-
30
-
31
-
32
-
33
-
34
-
35
-
36
-
37
-
38
-
39
-
40
-
41
-
42
-
43
-
44
-
45
-
46
-
47
-
48
-
49
-
50
-
51
-
52
-
53
-
54
-
55
-
56
-
57
-
58
-
59
-
60
-
61
-
62
-
63
-
64
-
65
-
66
-
67
-
68
 |
 |

ca
n
l
iv
e
bette
r
.
– W
a
l-M
a
r
t
’
s
mi
ss
i
o
n
a
r
ou
n
d
t
h
e
w
o
rl
d
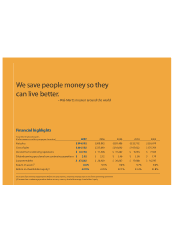
Financial highlights
F
isca
l
Years En
d
e
d
Januar
y
31
,
(
Do
ll
ar amounts in mi
ll
ions, except per s
h
are
d
ata) 2007
2006
200
5
200
4
2003
Net
sa
l
es
$ 344,992 $ 308
,
945 $ 281
,
488 $ 252
,
792 $ 226
,
479
Cost
o
f
sa
l
es
$ 264,152 $ 237
,
649 $ 216
,
832 $ 195
,
922 $ 175
,
769
I
ncome
f
rom continuing operations $ 12,178
$
11,408
$
10,482
$
9,096
$
7,940
D
iluted earnin
g
s per share from continuin
g
operations $ 2.92
$
2.72
$
2.46
$
2.08
$
1.79
L
on
g
-term debt $ 27,222 $ 26
,
429 $ 20
,
087 $ 17
,
088 $ 16
,
545
R
eturn on asset
s
(
1
)
8.8% 9.3
%
9.8
%
9.7
%
9.6
%
R
eturn on shareholders’ equit
y
(
2
)
22.0% 22.9
%
23.1
%
22.4
%
21.8
%
(
1) Income from continuing operations before minority interest, divided by average total assets from continuing operations.
(
2) Income
f
rom continuing operations be
f
ore minority interest, divided by average shareholders’ equity
.