Walmart 2007 Annual Report Download - page 37
Download and view the complete annual report
Please find page 37 of the 2007 Walmart annual report below. You can navigate through the pages in the report by either clicking on the pages listed below, or by using the keyword search tool below to find specific information within the annual report.-
 1
1 -
2
-
3
-
4
-
5
-
6
-
7
-
8
-
9
-
10
-
11
-
12
-
13
-
14
-
15
-
16
-
17
-
18
-
19
-
20
-
21
-
22
-
23
-
24
-
25
-
26
-
 27
27 -
 28
28 -
 29
29 -
 30
30 -
 31
31 -
 32
32 -
 33
33 -
 34
34 -
 35
35 -
 36
36 -
 37
37 -
 38
38 -
 39
39 -
 40
40 -
 41
41 -
 42
42 -
 43
43 -
 44
44 -
 45
45 -
 46
46 -
 47
47 -
48
-
49
-
50
-
51
-
52
-
53
-
54
-
55
-
56
-
57
-
58
-
59
-
60
-
61
-
62
-
63
-
64
-
65
-
66
-
67
-
68
 |
 |

Wal-Mart 2007 Annual Report 35
Management’s Discussion and Analysis of Financial Condition
and Results of Operations
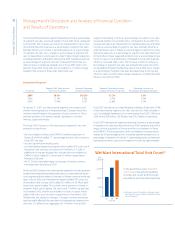
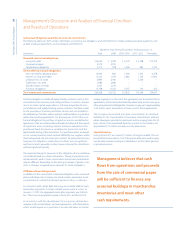
Management believes that cash ows from operations and proceeds
from the sale of commercial paper will be su cient to nance any
seasonal buildups in merchandise inventories and meet other cash
requirements. If our operating cash ows are not su cient to pay
dividends and to fund our capital expenditures, we anticipate funding
any shortfall in these expenditures with a combination of commercial
paper and long-term debt. We plan to re nance existing long-term
debt as it matures and may desire to obtain additional long-term
nancing for other corporate purposes. We anticipate no di culty in
obtaining long-term nancing in view of our credit rating and favor-
able experiences in the debt market in the recent past. The following
table details the ratings of the credit rating agencies that rated our
outstanding indebtedness at January 31, 2007.
Rating Agency Commercial Paper Long-Term Debt
Standard & Poor’s A-1 + AA
Moody’s Investors Service P-1 Aa2
Fitch Ratings F1 + AA
Dominion Bond Rating Service R-1(middle) AA
In the past, we have utilized total debt to total capitalization as the
primary metric to monitor our leverage. We now use the ratio of
adjusted cash ow from operations to adjusted average debt as our
primary leverage metric, which is also consistent with methods com-
monly used by credit rating agencies to determine our credit rating.
Adjusted cash ow from operations as the numerator is de ned as
cash ow from operations of continuing operations for the current
year plus two-thirds of the current year operating rent expense less
current year capitalized interest expense. Adjusted average debt as
the denominator is de ned as average debt plus eight times average
operating rent expense. Average debt is the simple average of begin-
ning and ending commercial paper, long-term debt due within one
year, obligations under capital leases due in one year, long-term debt,
and long-term obligations under capital leases. Average operating
rent expense is the simple average of current year and prior year
operating rent expense. We believe this metric is useful to investors
as it provides them with a tool to measure our leverage. The ratio, as
calculated below, exceeds the published threshold requirements to
maintain our current credit ratings.
Fiscal Year Ended
(Amounts in millions except for the calculated ratio) January 31, 2007
Cash ows from operating activities of continuing operations $20,209
+ Two-thirds current year operating rent expense(1) 961
– Current year capitalized interest expense 182
Numerator $20,988
Average debt(2) $38,874
Eight times average operating rent expense(3) 9,604
Denominator $48,478
Adjusted cash ow from operations to adjusted average debt(4) 43%
Cash ow from operations to average debt 52%
Selected nancial information
Fiscal year 2007 operating rent expense $ 1,441
Fiscal year 2006 operating rent expense 960
Fiscal year 2007 capitalized interest 182
Fiscal Year Ended
January 31, 2007 January 31, 2006
Commercial paper $ 2,570 $ 3,754
Long-term debt due in one year 5,428 4,595
Obligations under capital leases due within one year 285 284
Long-term debt 27,222 26,429
Long-term obligations under capital leases 3,513 3,667
Total debt $39,018 $38,729
(1) 2/3 X $1,441
(2) ($39,018 + $38,729)/2
(3) 8 X (($1,441 + $960)/2)
(4) The calculation of the ratio as de ned