Walmart 2007 Annual Report Download - page 35
Download and view the complete annual report
Please find page 35 of the 2007 Walmart annual report below. You can navigate through the pages in the report by either clicking on the pages listed below, or by using the keyword search tool below to find specific information within the annual report.-
 1
1 -
2
-
3
-
4
-
5
-
6
-
7
-
8
-
9
-
10
-
11
-
12
-
13
-
14
-
15
-
16
-
17
-
18
-
19
-
20
-
21
-
22
-
23
-
24
-
 25
25 -
 26
26 -
 27
27 -
 28
28 -
 29
29 -
 30
30 -
 31
31 -
 32
32 -
 33
33 -
 34
34 -
 35
35 -
 36
36 -
 37
37 -
 38
38 -
 39
39 -
 40
40 -
 41
41 -
 42
42 -
 43
43 -
 44
44 -
 45
45 -
46
-
47
-
48
-
49
-
50
-
51
-
52
-
53
-
54
-
55
-
56
-
57
-
58
-
59
-
60
-
61
-
62
-
63
-
64
-
65
-
66
-
67
-
68
 |
 |

Wal-Mart 2007 Annual Report 33
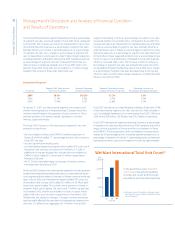
0.6 percentage points. The impact of the acquisitions was partially
o set by an increase in operating income as a percentage of segment
net sales in our other businesses in this segment. Overall, the
International segment’s gross margin of our other businesses was up
0.2 percentage points in scal 2007, primarily driven by improvements
in Mexico and Canada resulting from a favorable shift in the mix of
products sold toward general merchandise categories which carry a
higher margin. Fiscal 2007 operating expenses as a percentage of
segment net sales of our other businesses were essentially at when
compared to scal 2006. Fiscal 2007 operating income includes a
favorable impact of $90 million from changes in foreign currency
exchange rates.
While fiscal 2006 International segment operating income as a
percentage of segment net sales was down slightly from scal 2005,
segment gross margin was up 0.5 percentage points. This improve-
ment in segment gross margin was o set by an increase in operating
expenses and a decrease in other income, both as a percentage of seg-
ment net sales. The International segment’s scal 2006 improvement
in gross margin was primarily due to a favorable shift in the mix of prod-
ucts sold toward general merchandise categories which carry a higher
margin. The 0.5 percentage point increase in operating expenses as a
percentage of segment net sales in scal 2006 was driven primarily by
increased advertising, utility and insurance expenditures. Other income
as a percentage of segment net sales declined 0.2 percentage points
in scal 2006 primarily due to a reduction in rental income in Canada
and a payroll tax recovery in Mexico in scal 2005. Fiscal 2006 operat-
ing income includes a favorable impact of $68 million from changes
in foreign currency exchange rates.
Liquidity and Capital Resources
Overview
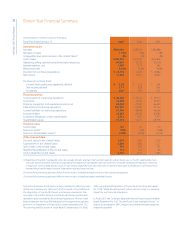
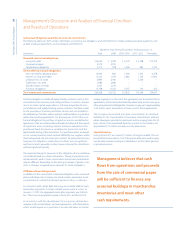
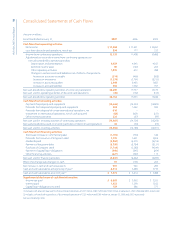
Cash ows provided by operating activities supply us with a signi cant
source of liquidity. Our cash ows from operating activities of continuing
operations were $20.2 billion, $17.7 billion and $15.2 billion in scal
2007, 2006 and 2005, respectively. The increases in cash ows provided
by operating activities for each scal year were primarily attributable
to improved income from continuing operations and improved man-
agement of inventory procurement resulting in accounts payable
growing at a faster rate than inventory.
In scal 2007, we paid dividends of $2.8 billion, made $15.7 billion in
capital expenditures, paid $1.7 billion in cash to repurchase shares of
our common stock, received $7.2 billion from the issuance of long-term
debt, repaid $5.8 billion of long-term debt and repaid $1.2 million of
commercial paper (net of issuances).
Working Capital
Current liabilities exceeded current assets at January 31, 2007, by
$5.2 billion, an increase of $166 million from January 31, 2006. Our
ratio of current assets to current liabilities was 0.9 to 1 at January 31,
2007 and 2006. At January 31, 2007, we had total assets of $151.2 bil-
lion, compared with total assets of $138.2 billion at January 31, 2006.
We generally have a working capital de cit due to our e cient use of
cash in funding operations and in providing returns to shareholders
in the form of share repurchases and payment of dividends.
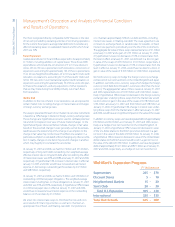
Company Share Repurchase Program
From time to time, we repurchase shares of our common stock under
a $10.0 billion share repurchase program authorized by our Board of
Directors in September 2004. During the rst half of scal 2006, we
repurchased $3.6 billion of shares under this repurchase program.
During the fourth quarter of scal 2007, we repurchased $1.8 billion of
shares under this repurchase program. At January 31, 2007, approxi-
mately $4.3 billion of additional shares may be repurchased under
this program.
There is no expiration date for or other restriction limiting the period
over which we can make our share repurchases under the program,
which will expire only when and if we have repurchased $10.0 billion
of our shares under the program. Under the program, repurchased shares
are constructively retired and returned to unissued status. We con-
sider several factors in determining when to make share repurchases,
including among other things, our current cash needs, our capacity for
leverage, our cost of borrowings, and the market price of the stock.
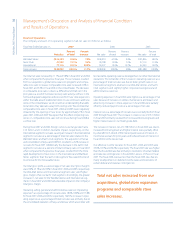
Common Stock Dividends
We paid dividends totaling approximately $2.8 billion, or $0.67 per
share, in scal 2007. The dividends paid in scal 2007 represent an
11.7% increase over scal 2006. The scal 2006 dividend of $0.60 per
share represented a 15.4% increase over fiscal 2005. We have
increased our dividend every year since the first dividend was
declared in March 1974.
On March 8, 2007, the Company’s Board of Directors approved an
increase in annual dividends to $0.88 per share, an increase of 31.3%
over the dividends paid in scal 2007. The annual dividend will be
paid in four quarterly installments on April 2, 2007, June 4, 2007,
September 4, 2007, and January 2, 2008 to holders of record on
March 16, May 18, August 17 and December 14, 2007, respectively.
Management’s Discussion and Analysis of Financial Condition
and Results of Operations
Wal-Mart paid dividends totaling
approximately $2.8 billion, or
$0.67 per share, in fiscal 2007.
The dividends paid in fiscal 2007
represent an 11.7% increase over
fiscal 2006.