Walmart 2007 Annual Report Download - page 32
Download and view the complete annual report
Please find page 32 of the 2007 Walmart annual report below. You can navigate through the pages in the report by either clicking on the pages listed below, or by using the keyword search tool below to find specific information within the annual report.-
 1
1 -
2
-
3
-
4
-
5
-
6
-
7
-
8
-
9
-
10
-
11
-
12
-
13
-
14
-
15
-
16
-
17
-
18
-
19
-
20
-
21
-
 22
22 -
 23
23 -
 24
24 -
 25
25 -
 26
26 -
 27
27 -
 28
28 -
 29
29 -
 30
30 -
 31
31 -
 32
32 -
 33
33 -
 34
34 -
 35
35 -
 36
36 -
 37
37 -
 38
38 -
 39
39 -
 40
40 -
 41
41 -
 42
42 -
43
-
44
-
45
-
46
-
47
-
48
-
49
-
50
-
51
-
52
-
53
-
54
-
55
-
56
-
57
-
58
-
59
-
60
-
61
-
62
-
63
-
64
-
65
-
66
-
67
-
68
 |
 |

Wal-Mart 2007 Annual Report 30
Results of Operations
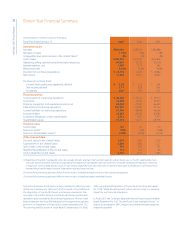
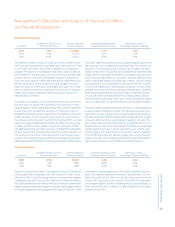
The Company and each of its operating segments had net sales (in millions), as follows:
Fiscal Year Ended January 31, 2007 2006 2005
Percent Percent Percent Percent Percent
Net sales of total increase Net sales of total increase Net sales of total
Wal-Mart Stores $226,294 65.6% 7.8% $209,910 67.9% 9.4% $191,826 68.1%
Sam’s Club 41,582 12.1% 4.5% 39,798 12.9% 7.2% 37,119 13.2%
International 77,116 22.3% 30.2% 59,237 19.2% 12.7% 52,543 18.7%
Total net sales $344,992 100.0% 11.7% $308,945 100.0% 9.8% $281,488 100.0%
Management’s Discussion and Analysis of Financial Condition
and Results of Operations
Our total net sales increased by 11.7% and 9.8% in scal 2007 and 2006
when compared to the previous scal year. Those increases resulted
from our acquisitions, global store expansion programs and compa-
rable store sales increases. Comparable store sales increased 2.0% in
scal 2007 and 3.4% in scal 2006 in the United States. The decrease
in comparable store sales is due to a di cult benchmark set in the
prior year as a result of hurricane recovery sales activity, softness in the
home and apparel categories and pressure from new store expansions
within the trade area of established stores. As we continue to add new
stores in the United States, we do so with an understanding that addi-
tional stores may take sales away from existing units. We estimate that
comparable store sales in scal 2007, 2006 and 2005 were negatively
impacted by the opening of new stores by approximately 1% in scal
years 2007, 2006 and 2005. We expect that this e ect of opening new
stores on comparable store sales will continue during scal 2008 at
a similar rate.
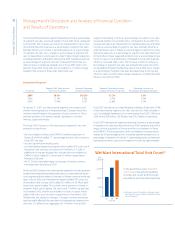
During scal 2007 and 2006, foreign currency exchange rates had a
$1.5 billion and $1.4 billion favorable impact, respectively, on the
International segment’s net sales, causing an increase in the International
segment’s net sales as a percentage of total net sales relative to the
Wal-Mart Stores and Sam’s Club segments. The acquisition of Sonae
and consolidation of Seiyu and CARHCO resulted in a 3.2% increase in
net sales for scal 2007. Additionally, the decrease in the Sam’s Club
segment’s net sales as a percent of total Company sales in scal 2007,
when compared to the previous scal years resulted from the more
rapid development of new stores in the International and Wal-Mart
Stores segments than the Sam’s Club segment. We expect this trend
to continue for the foreseeable future.
Our total gross pro t as a percentage of net sales (our “gross margin”)
was 23.4%, 23.1% and 23.0% in scal 2007, 2006 and 2005, respectively.
Our Wal-Mart Stores and International segment sales yield higher
gross margins than our Sam’s Club segment. Accordingly, the greater
increases in net sales for the Wal-Mart Stores and International seg-
ments in scal 2007 and 2006 had a favorable impact on the Company’s
total gross margin.
Operating, selling, general and administrative expenses (“operating
expenses”) as a percentage of net sales were 18.6%, 18.0% and 17.8%
for scal 2007, 2006 and 2005, respectively. Half the increase in oper-
ating expenses as a percentage of total net sales was primarily due to
the consolidated operations of Seiyu and Sonae, which are entities with
less favorable operating expense leverage than our other International
operations. The remainder of the increase in operating expenses as a
percentage of total net sales was due to faster growth rates in our
International segment relative to our Wal-Mart Stores and Sam’s
Club segments and slightly higher corporate-level general and
administrative expenses.
Operating expenses in scal 2006 were higher as a percentage of net
sales because of increases in utilities, maintenance and repairs and
advertising. Increases in these expenses in scal 2006 were partially
o set by reduced payroll costs as a percentage of net sales.
Interest, net, as a percentage of net sales was essentially at from scal
2005 through scal 2007. The increase in interest, net, of $351 million
in scal 2007 primarily resulted from increased borrowing levels and
higher interest rates on our oating-rate debt.
The increase in interest, net, of $198 million in scal 2006 was due to
increased borrowing levels and higher interest rates, partially o set
by a bene t from refund of IRS interest paid, reversal of interest on
income tax accruals for prior years, and reduced levels of interest on
scal 2006 income tax accruals.
Our e ective income tax rates for scal 2007, 2006 and 2005 were
33.6%, 33.1% and 34.2%, respectively. The scal 2007 rate was higher
than the scal 2006 rate due primarily to resolutions of certain federal
and state tax contingencies in scal 2006 in excess of those in scal
2007. The scal 2006 rate was less than the scal 2005 rate, due pri-
marily to adjustments in deferred income taxes and resolutions of
certain federal and state tax contingencies.
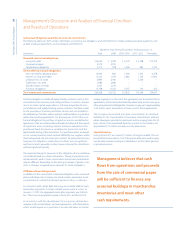
Total net sales increased from our
acquisitions, global store expansion
programs and comparable store
sales increases.