Walmart 2007 Annual Report Download - page 31
Download and view the complete annual report
Please find page 31 of the 2007 Walmart annual report below. You can navigate through the pages in the report by either clicking on the pages listed below, or by using the keyword search tool below to find specific information within the annual report.-
 1
1 -
2
-
3
-
4
-
5
-
6
-
7
-
8
-
9
-
10
-
11
-
12
-
13
-
14
-
15
-
16
-
17
-
18
-
19
-
20
-
 21
21 -
 22
22 -
 23
23 -
 24
24 -
 25
25 -
 26
26 -
 27
27 -
 28
28 -
 29
29 -
 30
30 -
 31
31 -
 32
32 -
 33
33 -
 34
34 -
 35
35 -
 36
36 -
 37
37 -
 38
38 -
 39
39 -
 40
40 -
 41
41 -
42
-
43
-
44
-
45
-
46
-
47
-
48
-
49
-
50
-
51
-
52
-
53
-
54
-
55
-
56
-
57
-
58
-
59
-
60
-
61
-
62
-
63
-
64
-
65
-
66
-
67
-
68
 |
 |

Wal-Mart 2007 Annual Report 29
businesses. Additionally, we compete with a number of companies for
prime retail site locations, as well as in attracting and retaining quality
employees (“associates”). We, along with other retail companies, are
in uenced by a number of factors including, but not limited to: cost of
goods, consumer debt levels and buying patterns, economic conditions,
interest rates, customer preferences, unemployment, labor costs,
in ation, currency exchange uctuations, fuel prices, weather patterns,
catastrophic events, competitive pressures and insurance costs. Our
Sam’s Club segment faces strong sales competition from other whole-
sale club operators, catalogs businesses, internet-based and other
retailers. Further information on risks to our Company can be located
in “Item 1A, Risk Factors,” in our Annual Report on Form 10-K for the
year ended January 31, 2007.
Key Items in Fiscal 2007
Signi cant nancial items during scal 2007 include:
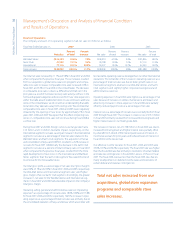
• Net sales increased 11.7% to $345.0 billion in scal 2007, and income
from continuing operations increased 6.7% to $12.2 billion. Foreign
currency exchange rates favorably impacted sales and operating
income by $1.5 billion and $90 million, respectively, in scal 2007.
• Net cash provided by operating activities of continuing operations
was $20.2 billion for scal 2007. During scal 2007, we paid $1.7 bil-
lion in cash to repurchase our common stock and paid dividends of
$2.8 billion. Additionally during scal 2007, we issued $7.2 billion in
long-term debt, repaid $5.8 billion of long-term debt and funded a
decrease in commercial paper of $1.2 billion (net of issuances).
• Total assets increased 9.4%, to $151.2 billion at January 31, 2007,
when compared to January 31, 2006. During scal 2007, we made
$15.7 billion of capital expenditures which was an increase of 7.8%
over capital expenditures of $14.5 billion in scal 2006.
• When compared to fiscal 2006, our Wal-Mart Stores segment
experienced an 11.1% increase in operating income and a 7.8%
increase in net sales in fiscal 2007.
• Sam’s Club’s continued focus on the needs of each individual member
helped drive a 9.2% increase in operating income on a 4.5% increase
in net sales when comparing scal 2007 with scal 2006.
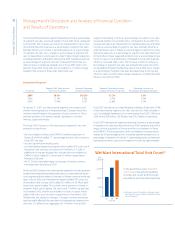
• Our International segment generated an operating income increase
of 21.5% and a 30.2% increase in net sales compared to scal 2006.
Fiscal 2007 sales in the International segment include sales from the
consolidation of The Seiyu, Ltd. (“Seiyu”) and Central American Retail
Holding Company (“CARHCO”), now known as Wal-Mart Central
America, and the acquisition of Sonae Distribuição Brasil S.A. (“Sonae”).
These entities contributed 17.1 percentage points to the increase in
the International segment net sales in scal 2007.
• During scal 2007, we disposed of our South Korean and German
operations. Both dispositions have been presented as discontinued
operations in our Consolidated Financial Statements for all periods.
For further details of these transactions, see Note 6 to our Consolidated
Financial Statements.
Company Performance Measures
Management uses a number of metrics to assess the Company’s
performance including:
• comparable store sales,
• operating income growth greater than net sales growth,
• inventory growth less than net sales growth and
• return on average assets.
Comparable store sales is a measure which indicates the performance
of our existing stores by measuring the growth in sales for such stores
for a particular period over the corresponding period in the prior year.
Our Wal-Mart Stores segment’s comparable store sales were 1.9% for
scal 2007 versus 3.0% for scal 2006. Our Sam’s Club segment’s
comparable club sales were 2.5% in scal 2007 versus 5.0% in scal
2006, including the impact of fuel sales.
Operating income growth greater than net sales growth has long been
a measure of success for us. For scal 2007, our operating income
increased by 9.5% when compared to scal 2006, while net sales
increased by 11.7% over the same period. Our Wal-Mart Stores and
Sam’s Club segments met this target; however, the International
segment did not due to the impact of the newly acquired and
consolidated entities.
Inventory growth at a rate less than that of net sales is a key measure
of our e ciency. Total inventories at January 31, 2007, were up 5.6%
over levels at January 31, 2006, and net sales were up 11.7% when
comparing scal 2007 with scal 2006.
With an asset base as large as ours, we are focused on continuing to
make certain our assets are productive. It is important for us to sus-
tain our return on assets. Return on assets is de ned as income from
continuing operations before minority interest divided by average
total assets from continuing operations. Return on assets for scal
2007, 2006 and 2005 was 8.8%, 9.3% and 9.8%, respectively. Return
on assets in scal 2007 and 2006 was impacted by acquisition and
consolidation of entities with lower asset returns.
Management’s Discussion and Analysis of Financial Condition
and Results of Operations
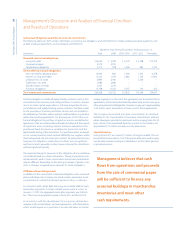
Net cash provided by operating
activities of continuing operations
was $20.2 billion for fiscal 2007.