Walmart 2007 Annual Report Download - page 33
Download and view the complete annual report
Please find page 33 of the 2007 Walmart annual report below. You can navigate through the pages in the report by either clicking on the pages listed below, or by using the keyword search tool below to find specific information within the annual report.-
 1
1 -
2
-
3
-
4
-
5
-
6
-
7
-
8
-
9
-
10
-
11
-
12
-
13
-
14
-
15
-
16
-
17
-
18
-
19
-
20
-
21
-
22
-
 23
23 -
 24
24 -
 25
25 -
 26
26 -
 27
27 -
 28
28 -
 29
29 -
 30
30 -
 31
31 -
 32
32 -
 33
33 -
 34
34 -
 35
35 -
 36
36 -
 37
37 -
 38
38 -
 39
39 -
 40
40 -
 41
41 -
 42
42 -
 43
43 -
44
-
45
-
46
-
47
-
48
-
49
-
50
-
51
-
52
-
53
-
54
-
55
-
56
-
57
-
58
-
59
-
60
-
61
-
62
-
63
-
64
-
65
-
66
-
67
-
68
 |
 |

Wal-Mart 2007 Annual Report 31
The segment net sales increases in scal 2007 and scal 2006 from the
prior scal years resulted from comparable store sales increases of 1.9%
in scal 2007 and 3.0% in scal 2006, in addition to our expansion
program. The decrease in comparable store sales is due to a di cult
benchmark set in the prior year as a result of hurricane recovery sales
activity, softness in the home and apparel categories and pressure
from new store expansion within the trade area of established stores.
We have developed several initiatives to help mitigate new store
expansion pressure and to grow comparable store sales. These initia-
tives include becoming more relevant to the customer by creating a
better store shopping experience and continuing to improve our
merchandise assortment.
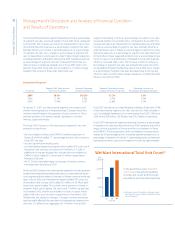
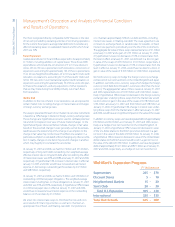
Our expansion programs consist of opening new units, converting
discount stores to supercenters, relocating units that result in more
square footage, as well as expanding existing stores. Segment expansion
during scal 2007 included the opening of 15 discount stores, 12
Neighborhood Markets and 276 supercenters (including the conversion
and/or relocation of 147 existing discount stores into supercenters).
Two discount stores closed in scal 2007. During scal 2007, our total
expansion program added approximately 42 million of store square
footage, an 8.4% increase. Segment expansion during scal 2006
included the opening of 24 discount stores, 15 Neighborhood Markets
and 267 supercenters (including the conversion and/or relocation of
166 existing discount stores into supercenters). Two discount stores
closed in scal 2006. During scal 2006, our total expansion program
added approximately 39 million of store square footage, an 8.6% increase.
Fiscal 2007 segment operating income as a percentage of segment net
sales was up 0.2 percentage points over scal 2006. This increase was
driven by a 0.2 percentage point increase in gross margin. The gross
margin increase from scal 2006 can be attributed to improved initial
margin rates in the general merchandise and food areas of our business
and a scal 2006 adjustment to our product warranty liabilities which
had an unfavorable impact on last year’s gross margin. Our gross margin
increased despite our competitive pricing expansion and our increase
in the cost of markdowns as a percentage of segment net sales, which
primarily occurred in our home and apparel merchandise assortments.
Segment operating expenses as a percentage of segment net sales
in scal 2007 were essentially at from scal 2006, primarily due to
improved labor productivity in the stores, which was o set by higher
costs associated with our store maintenance and remodel programs.
Fiscal 2006 segment operating income was down 0.1 percentage points
as a percentage of segment net sales. This decrease was driven by a
slight decline in gross margin and a 0.1 percentage point increase in
operating expenses from scal 2006 levels, partially o set by a slight
increase in other income as a percentage of segment net sales. The
gross margin decrease from scal 2005 can be attributed to the con-
tinued increase in sales of our lower-margin food items as a percentage
of total segment net sales, rising transportation costs, and the unfa-
vorable impact of an adjustment to our product warranty liabilities
in scal 2006. The segment’s operating expenses as a percentage of
segment net sales in scal 2006 were higher than scal 2005 primarily
due to expense pressures from utilities and advertising costs.
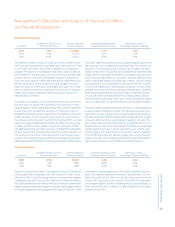
Wal-Mart Stores Segment
Segment Net Sales Increase Segment Operating Segment Operating Income Operating Income as a
Fiscal Year from Prior Fiscal Year Income (in millions) Increase from Prior Fiscal Year Percentage of Segment Net Sales
2007 7.8% $17,029 11.1% 7.5%
2006 9.4% 15,324 8.2% 7.3%
2005 10.1% 14,163 9.7% 7.4%
Management’s Discussion and Analysis of Financial Condition
and Results of Operations
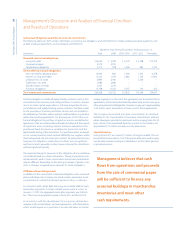
Sam’s Club Segment
Segment Net Sales Increase Segment Operating Segment Operating Income Operating Income as a
Fiscal Year from Prior Fiscal Year Income (in millions) Increase from Prior Fiscal Year Percentage of Segment Net Sales
2007 4.5% $1,512 9.2% 3.6%
2006 7.2% 1,385 8.2% 3.5%
2005 7.5% 1,280 13.7% 3.4%
Growth in net sales for the Sam’s Club segment in scal 2007 and scal
2006 resulted from comparable club sales increases of 2.5% in scal
2007 and 5.0% in scal 2006, along with our club expansion program.
Comparable club sales in scal 2007 increased at a slower rate than in
scal 2006 primarily due to lower growth rates in fuel and certain food-
related categories and media categories. Fuel sales had a negative impact
of 0.4 percentage points on comparable club sales in scal 2007, while
contributing 1.3 percentage points to scal 2006 comparable club sales.
Sam’s Club segment expansion consisted of the opening of 15 new
clubs in scal 2007 and 17 clubs in scal 2006. Three clubs were closed
in scal 2007 and one club was closed in scal 2006. Our total expan-
sion program added 2.9 million of additional club square footage, or
3.9%, in scal 2007 and 2.7 million, or 3.8%, of additional club square
footage in scal 2006.