Walmart 2007 Annual Report Download - page 38
Download and view the complete annual report
Please find page 38 of the 2007 Walmart annual report below. You can navigate through the pages in the report by either clicking on the pages listed below, or by using the keyword search tool below to find specific information within the annual report.-
 1
1 -
2
-
3
-
4
-
5
-
6
-
7
-
8
-
9
-
10
-
11
-
12
-
13
-
14
-
15
-
16
-
17
-
18
-
19
-
20
-
21
-
22
-
23
-
24
-
25
-
26
-
27
-
 28
28 -
 29
29 -
 30
30 -
 31
31 -
 32
32 -
 33
33 -
 34
34 -
 35
35 -
 36
36 -
 37
37 -
 38
38 -
 39
39 -
 40
40 -
 41
41 -
 42
42 -
 43
43 -
 44
44 -
 45
45 -
 46
46 -
 47
47 -
 48
48 -
49
-
50
-
51
-
52
-
53
-
54
-
55
-
56
-
57
-
58
-
59
-
60
-
61
-
62
-
63
-
64
-
65
-
66
-
67
-
68
 |
 |

Wal-Mart 2007 Annual Report 36
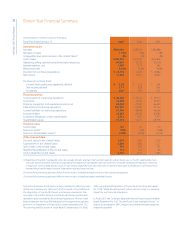
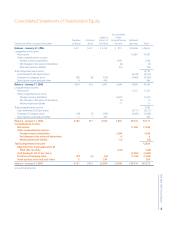
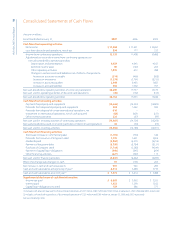
The most recognized directly comparable GAAP measure is the ratio
of net cash provided by operating activities of continuing operations
for the current scal year to average total debt (which excludes any
a ect of operating leases or capitalized interest) and for which scal
2007 was 52%.
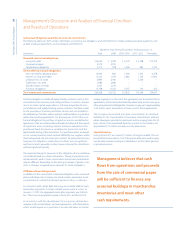
Future Expansion
Capital expenditures for scal 2008 are expected to be approximately
$17 billion, including additions of capital leases. These scal 2008
expenditures will include the construction of 5 to 10 new discount
stores, 265 to 270 new supercenters (with relocations, conversions or
expansions accounting for approximately 145 of those supercenters),
15 to 20 new Neighborhood Markets, 20 to 30 new Sam’s Clubs (with
relocations or expansions accounting for 15 of those Sam’s Clubs) and
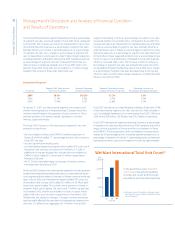
320 to 330 new units in our International segment (with relocations or
expansions accounting for approximately 30 of those units). We plan
to nance this expansion, and any acquisitions of other operations
that we may make during scal 2008, primarily out of cash ows
from operations.
Market Risk
In addition to the risks inherent in our operations, we are exposed to
certain market risks, including changes in interest rates and changes
in foreign currency exchange rates.
The analysis presented for each of our market risk sensitive instruments
is based on a 10% change in interest or foreign currency exchange rates.
These changes are hypothetical scenarios used to calibrate potential
risk and do not represent our view of future market changes. As the
hypothetical gures discussed below indicate, changes in fair value
based on the assumed change in rates generally cannot be extrapo-
lated because the relationship of the change in assumption to the
change in fair value may not be linear. The e ect of a variation in a
particular assumption is calculated without changing any other assump-
tion. In reality, changes in one factor may result in changes in another,
which may magnify or counteract the sensitivities.
At January 31, 2007 and 2006, we had $32.7 billion and $31.0 billion,
respectively, of long-term debt outstanding. Our weighted-average
e ective interest rate on long-term debt, after considering the e ect
of interest rate swaps, was 4.9% and 4.8% at January 31, 2007 and 2006,
respectively. A hypothetical 10% increase in interest rates in e ect at
January 31, 2007 and 2006, would have increased annual interest
expense on borrowings outstanding at those dates by $47 million
and $48 million, respectively.
At January 31, 2007 and 2006, we had $2.6 billion and $3.8 billion of
outstanding commercial paper obligations. The weighted-average
interest rate, including fees, on these obligations at January 31, 2007
and 2006, was 5.3% and 3.9%, respectively. A hypothetical 10% increase
in commercial paper rates in e ect at January 31, 2007 and 2006,
would have increased annual interest expense on the outstanding
balances on those dates by $14 million.
We enter into interest rate swaps to minimize the risks and costs
associated with financing activities, as well as to maintain an
appropriate mix of xed- and oating-rate debt. Our preference
is to maintain approximately 50% of our debt portfolio, including
interest rate swaps, in oating-rate debt. The swap agreements are
contracts to exchange xed- or variable-rates for variable- or xed-
interest rate payments periodically over the life of the instruments.
The aggregate fair value of these swaps represented a loss of $1 million
at January 31, 2007 and a gain of $133 million at January 31, 2006.
A hypothetical increase (or decrease) of 10% in interest rates from
the level in e ect at January 31, 2007, would result in a (loss) or gain
in value of the swaps of ($95 million) or $103 million, respectively. A
hypothetical increase (or decrease) of 10% in interest rates from the
level in e ect at January 31, 2006, would have resulted in a (loss) or
gain in value of the swaps of ($103 million) or $104 million, respectively.
We hold currency swaps to hedge the foreign currency exchange
component of our net investments in the United Kingdom and Japan.
In addition, we hold a cross-currency swap which hedges the foreign
currency risk of debt denominated in currencies other than the local
currency. The aggregate fair value of these swaps at January 31, 2007
and 2006, represented a loss of $181 million and $124 million, respec-
tively. A hypothetical 10% increase (or decrease) in the foreign currency
exchange rates underlying these swaps from the market rate would
result in a (loss) or gain in the value of the swaps of ($178 million) and
$196 million at January 31, 2007, and ($96 million) and $78 million at
January 31, 2006. A hypothetical 10% change in interest rates under-
lying these swaps from the market rates in e ect at January 31, 2007
and 2006, would have an insigni cant impact on the value of the swaps.
In addition to currency swaps, we have designated debt of approximately
£3.0 billion and £2.0 billion as of January 31, 2007 and 2006, respec-
tively, as a hedge of our net investment in the United Kingdom. At
January 31, 2007, a hypothetical 10% increase (or decrease) in value
of the U.S. dollar relative to the British pound would result in a gain
(or loss) in the value of the debt of $594 million. At January 31, 2006,
a hypothetical 10% increase (or decrease) in value of the United States
dollar relative to the British pound would result in a gain (or loss) in
the value of the debt of $359 million. In addition, we have designated
debt of approximately ¥142.1 billion and ¥87.1 billion as of January 31,
2007 and 2006, respectively, as a hedge of our net investment in
Management’s Discussion and Analysis of Financial Condition
and Results of Operations
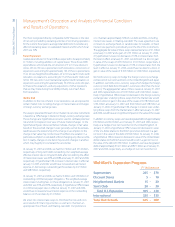
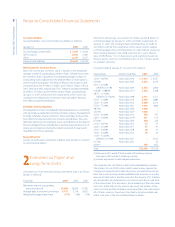
Wal-Mart’s Expansion Program
FY ’08 Expansion
Supercenters 265 - 270
Discount Stores 5 - 10
Neighborhood Markets 15 - 20
Sam’s Club 20 - 30
Total U.S. Expansion 305 - 330
International 320 - 330
Total Unit Growth 625 - 660