Walmart 2007 Annual Report Download - page 60
Download and view the complete annual report
Please find page 60 of the 2007 Walmart annual report below. You can navigate through the pages in the report by either clicking on the pages listed below, or by using the keyword search tool below to find specific information within the annual report.-
 1
1 -
2
-
3
-
4
-
5
-
6
-
7
-
8
-
9
-
10
-
11
-
12
-
13
-
14
-
15
-
16
-
17
-
18
-
19
-
20
-
21
-
22
-
23
-
24
-
25
-
26
-
27
-
28
-
29
-
30
-
31
-
32
-
33
-
34
-
35
-
36
-
37
-
38
-
39
-
40
-
41
-
42
-
43
-
44
-
45
-
46
-
47
-
48
-
49
-
 50
50 -
 51
51 -
 52
52 -
 53
53 -
 54
54 -
 55
55 -
 56
56 -
 57
57 -
 58
58 -
 59
59 -
 60
60 -
 61
61 -
 62
62 -
 63
63 -
 64
64 -
 65
65 -
 66
66 -
 67
67 -
 68
68
 |
 |

Wal-Mart 2007 Annual Report 58
Notes to Consolidated Financial Statements
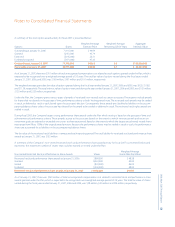
In the United States, long-lived assets, net, excluding goodwill and
other assets and deferred charges were $62.3 billion, $55.5 billion
and $48.4 billion as of January 31, 2007, 2006 and 2005, respectively.
In the United States, additions to long-lived assets were $12.2 billion,
$11.8 billion and $9.8 billion in scal 2007, 2006 and 2005, respectively.
Outside of the United States, long-lived assets, net, excluding goodwill
and other assets and deferred charges were $26.1 billion, $22.4 billion
and $18.1 billion in scal 2007, 2006 and 2005, respectively. Outside
of the United States, additions to long-lived assets were $3.5 billion,
$2.7 billion and $3.0 billion in scal 2007, 2006 and 2005, respectively.
The International segment includes all real estate outside the United
States. The operations of the Company’s Asda subsidiary are signi cant
in comparison to the total operations of the International segment. Asda
sales during scal 2007, 2006 and 2005 were $28.9 billion, $26.8 billion
and $26.0 billion, respectively. Asda long-lived assets, consisting primar-
ily of property and equipment, net, totaled $13.3 billion, $11.0 billion,
and $11.3 billion at January 31, 2007, 2006 and 2005, respectively.
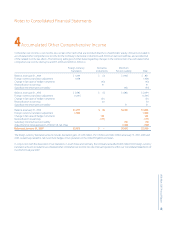
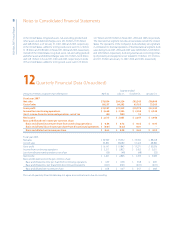
12 Quarterly Financial Data (Unaudited)
Quarter ended
(Amounts in millions, except per share information) April 30, July 31, October 31, January 31,
Fiscal year 2007
Net sales $78,834 $84,524 $83,543 $98,090
Cost of sales 60,237 64,585 63,765 75,565
Gross pro t $18,597 $19,939 $19,778 $22,525
Income from continuing operations $ 2,660 $ 2,984 $ 2,594 $ 3,940
(Loss) income from discontinued operations, net of tax (45) (901) 53 –
Net income $ 2,615 $ 2,083 $ 2,647 $ 3,940
Basic and diluted net income per common share:
Basic and diluted income per share from continuing operations $ 0.64 $ 0.72 $ 0.62 $ 0.95
Basic and diluted (loss) income per share from discontinued operations $ (0.01) (0.22) 0.01 –
Basic and diluted net income per share $ 0.63 $ 0.50 $ 0.63 $ 0.95
Fiscal year 2006
Net sales $ 69,999 $ 75,932 $ 74,596 $ 88,418
Cost of sales 53,852 58,089 57,325 68,382
Gross pro t $ 16,147 $ 17,843 $ 17,271 $ 20,036
Income from continuing operations $ 2,511 $ 2,853 $ 2,422 $ 3,621
Loss from discontinued operations, net of tax (50) (48) (48) (32)
Net income $ 2,461 $ 2,805 $ 2,374 $ 3,589
Basic and diluted net income per common share:
Basic and diluted income per share from continuing operations $ 0.59 $ 0.68 $ 0.58 $ 0.87
Basic and diluted loss per share from discontinued operations (0.01) (0.01) (0.01) (0.01)
Basic and diluted net income per share $ 0.58 $ 0.67 $ 0.57 $ 0.86
The sum of quarterly nancial data may not agree to annual amounts due to rounding.