Walmart 2007 Annual Report Download - page 28
Download and view the complete annual report
Please find page 28 of the 2007 Walmart annual report below. You can navigate through the pages in the report by either clicking on the pages listed below, or by using the keyword search tool below to find specific information within the annual report.-
 1
1 -
2
-
3
-
4
-
5
-
6
-
7
-
8
-
9
-
10
-
11
-
12
-
13
-
14
-
15
-
16
-
17
-
 18
18 -
 19
19 -
 20
20 -
 21
21 -
 22
22 -
 23
23 -
 24
24 -
 25
25 -
 26
26 -
 27
27 -
 28
28 -
 29
29 -
 30
30 -
 31
31 -
 32
32 -
 33
33 -
 34
34 -
 35
35 -
 36
36 -
 37
37 -
 38
38 -
39
-
40
-
41
-
42
-
43
-
44
-
45
-
46
-
47
-
48
-
49
-
50
-
51
-
52
-
53
-
54
-
55
-
56
-
57
-
58
-
59
-
60
-
61
-
62
-
63
-
64
-
65
-
66
-
67
-
68
 |
 |
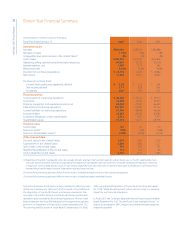
Wal-Mart 2007 Annual Report 26
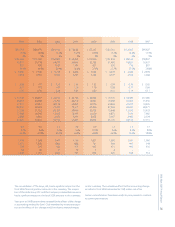
(Dollar amounts in millions, except per share data)
Fiscal Year Ended January 31, 2007 2006 2005
Operating results
Net sales $344,992 $308,945 $281,488
Net sales increase 11.7% 9.8% 11.4%
Comparable store sales increase in the United States(1) 2% 3% 3%
Cost of sales $264,152 $237,649 $216,832
Operating, selling, general and administrative expenses 64,001 55,739 50,178
Interest expense, net 1,529 1,178 980
E ective tax rate 33.6% 33.1% 34.2%
Income from continuing operations $ 12,178 $ 11,408 $ 10,482
Net income 11,284 11,231 10,267
Per share of common stock:
Income from continuing operations, diluted $ 2.92 $ 2.72 $ 2.46
Net income, diluted 2.71 2.68 2.41
Dividends 0.67 0.60 0.52
Financial position
Current assets of continuing operations $ 46,588 $ 43,146 $ 37,913
Inventories 33,685 31,910 29,419
Property, equipment and capital lease assets, net 88,440 77,865 66,549
Total assets of continuing operations 151,193 135,624 117,139
Current liabilities of continuing operations 51,754 48,348 42,609
Long-term debt 27,222 26,429 20,087
Long-term obligations under capital leases 3,513 3,667 3,073
Shareholders’ equity 61,573 53,171 49,396
Financial ratios
Current ratio 0.9 0.9 0.9
Return on assets(2) 8.8% 9.3% 9.8%
Return on shareholders’ equity(3) 22.0% 22.9% 23.1%
Other year-end data
Discount stores in the United States 1,075 1,209 1,353
Supercenters in the United States 2,256 1,980 1,713
Sam’s Clubs in the United States 579 567 551
Neighborhood Markets in the United States 112 100 85
Units outside the United States 2,757 2,181 1,480
(1) Beginning in scal 2007, comparable store sales includes all stores and clubs that have been open for at least the previous 12 months. Additionally, stores
and clubs that are relocated, converted or expanded are excluded from comparable store sales for the rst 12 months following the relocation, conversion
or expansion. For scal 2006 and prior years, we considered comparable store sales to be sales at stores that were open as of February 1st of the prior scal
year and which had not been converted, expanded or relocated since that date.
(2) Income from continuing operations before minority interest, divided by average total assets from continuing operations.
(3) Income from continuing operations before minority interest, divided by average shareholders’ equity.
Financial information for all years has been restated to re ect the sale
of McLane Company, Inc. (“McLane”) that occurred in scal 2004 and
the disposition of our South Korean and German operations that
occurred in scal 2007. McLane and the South Korean and German
operations are presented as discontinued operations. All years have
been restated for the scal 2004 adoption of the expense recognition
provisions of Statement of Financial Accounting Standards No. 123,
“Accounting and Disclosure of Stock-Based Compensation.” In scal
2005, we adopted Statement of Financial Accounting Standards
No. 123R, “Share-Based Payment,” which did not result in a material
impact to our nancial statements.
In scal 2003, the Company adopted Financial Accounting Standards
Board Statement No. 142, “Goodwill and Other Intangible Assets.” In
years prior to adoption, the Company recorded amortization expense
related to goodwill.
Eleven-Year Financial Summary