Walmart 2007 Annual Report Download - page 44
Download and view the complete annual report
Please find page 44 of the 2007 Walmart annual report below. You can navigate through the pages in the report by either clicking on the pages listed below, or by using the keyword search tool below to find specific information within the annual report.-
 1
1 -
2
-
3
-
4
-
5
-
6
-
7
-
8
-
9
-
10
-
11
-
12
-
13
-
14
-
15
-
16
-
17
-
18
-
19
-
20
-
21
-
22
-
23
-
24
-
25
-
26
-
27
-
28
-
29
-
30
-
31
-
32
-
33
-
 34
34 -
 35
35 -
 36
36 -
 37
37 -
 38
38 -
 39
39 -
 40
40 -
 41
41 -
 42
42 -
 43
43 -
 44
44 -
 45
45 -
 46
46 -
 47
47 -
 48
48 -
 49
49 -
 50
50 -
 51
51 -
 52
52 -
 53
53 -
 54
54 -
55
-
56
-
57
-
58
-
59
-
60
-
61
-
62
-
63
-
64
-
65
-
66
-
67
-
68
 |
 |

Wal-Mart 2007 Annual Report 42
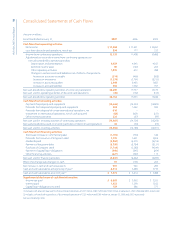
Consolidated Statements of Cash Flows
(Amounts in millions)
Fiscal Year Ended January 31, 2007 2006 2005
Cash ows from operating activities
Net income $ 11,284 $ 11,231 $ 10,267
Loss from discontinued operations, net of tax 894 177 215
Income from continuing operations 12,178 11,408 10,482
Adjustments to reconcile income from continuing operations to
net cash provided by operating activities:
Depreciation and amortization 5,459 4,645 4,185
Deferred income taxes 89 (129) 263
Other operating activities 1,039 613 388
Changes in certain assets and liabilities, net of e ects of acquisitions:
Increase in accounts receivable (214) (466) (302)
Increase in inventories (1,274) (1,761) (2,515)
Increase in accounts payable 2,344 2,425 1,681
Increase in accrued liabilities 588 1,002 997
Net cash provided by operating activities of continuing operations 20,209 17,737 15,179
Net cash used in operating activities of discontinued operations (45) (102) (135)
Net cash provided by operating activities 20,164 17,635 15,044
Cash ows from investing activities
Payments for property and equipment (15,666) (14,530) (12,803)
Proceeds from disposal of property and equipment 394 1,042 925
Proceeds from disposal of certain international operations, net 610 – –
Investment in international operations, net of cash acquired (68) (601) (315)
Other investing activities 223 (67) (99)
Net cash used in investing activities of continuing operations (14,507) (14,156) (12,292)
Net cash provided by (used in) investing activities of discontinued operations 44 (30) (59)
Net cash used in investing activities (14,463) (14,186) (12,351)
Cash ows from nancing activities
(Decrease) increase in commercial paper (1,193) (704) 544
Proceeds from issuance of long-term debt 7,199 7,691 5,832
Dividends paid (2,802) (2,511) (2,214)
Payment of long-term debt (5,758) (2,724) (2,131)
Purchase of Company stock (1,718) (3,580) (4,549)
Payment of capital lease obligations (340) (245) (204)
Other nancing activities (227) (349) 113
Net cash used in nancing activities (4,839) (2,422) (2,609)
E ect of exchange rate changes on cash 97 (101) 205
Net increase in cash and cash equivalents 959 926 289
Cash and cash equivalents at beginning of year(1) 6,414 5,488 5,199
Cash and cash equivalents at end of year(2) $ 7,373 $ 6,414 $ 5,488
Supplemental disclosure of cash ow information
Income tax paid $ 6,665 $ 5,962 $ 5,593
Interest paid 1,553 1,390 1,163
Capital lease obligations incurred 159 286 377
(1) Includes cash and cash equivalents of discontinued operations of $221 million, $383 million and $336 million at January 31, 2007, 2006 and 2005, respectively.
(2) Includes cash and cash equivalents of discontinued operations of $221 million and $383 million at January 31, 2006 and 2005, respectively.
See accompanying notes.