Walmart 2007 Annual Report Download - page 48
Download and view the complete annual report
Please find page 48 of the 2007 Walmart annual report below. You can navigate through the pages in the report by either clicking on the pages listed below, or by using the keyword search tool below to find specific information within the annual report.-
 1
1 -
2
-
3
-
4
-
5
-
6
-
7
-
8
-
9
-
10
-
11
-
12
-
13
-
14
-
15
-
16
-
17
-
18
-
19
-
20
-
21
-
22
-
23
-
24
-
25
-
26
-
27
-
28
-
29
-
30
-
31
-
32
-
33
-
34
-
35
-
36
-
37
-
 38
38 -
 39
39 -
 40
40 -
 41
41 -
 42
42 -
 43
43 -
 44
44 -
 45
45 -
 46
46 -
 47
47 -
 48
48 -
 49
49 -
 50
50 -
 51
51 -
 52
52 -
 53
53 -
 54
54 -
 55
55 -
 56
56 -
 57
57 -
 58
58 -
59
-
60
-
61
-
62
-
63
-
64
-
65
-
66
-
67
-
68
 |
 |

Wal-Mart 2007 Annual Report 46
Accrued Liabilities
Accrued liabilities consist of the following (dollars in millions):
January 31, 2007 2006
Accrued wages and bene ts $ 5,347 $ 4,414
Self-insurance 2,954 2,583
Other 6,374 6,277
Total accrued liabilities $14,675 $13,274
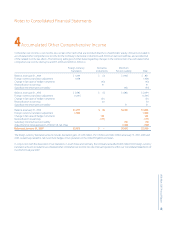
Net Income Per Common Share
Basic net income per common share is based on the weighted-
average number of outstanding common shares. Diluted net income
per common share is based on the weighted-average number of
outstanding shares adjusted for the dilutive e ect of stock options
and restricted stock grants. The dilutive e ect of stock options and
restricted stock was 4 million, 5 million and 7 million shares in scal
2007, 2006 and 2005, respectively. The Company had approximately
62 million, 57 million and 59 million option shares outstanding at
January 31, 2007, 2006 and 2005, respectively, which were not
included in the diluted net income per share calculation because
their e ect would be antidilutive.
Estimates and Assumptions
The preparation of our Consolidated Financial Statements in conformity
with generally accepted accounting principles requires management
to make estimates and assumptions. These estimates and assump-
tions a ect the reported amounts of assets and liabilities. They also
a ect the disclosure of contingent assets and liabilities at the date of
the Consolidated Financial Statements and the reported amounts of
revenues and expenses during the reporting period. Actual results
may di er from those estimates.
Reclassi cations
Certain reclassi cations have been made to prior periods to conform
to current presentations.
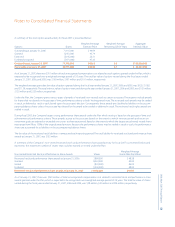
2
Commercial Paper and
Long-Term Debt
Information on short-term borrowings and interest rates is as follows
(dollars in millions):
Fiscal Year 2007 2006 2005
Maximum amount outstanding
at any month end $7,968 $9,054 $7,782
Average daily short-term borrowings 4,741 5,719 4,823
Weighted-average interest rate 4.7% 3.4% 1.6%
Short-term borrowings consisted of $2.6 billion and $3.8 billion of
commercial paper at January 31, 2007 and 2006, respectively. At
January 31, 2007, the Company had committed lines of credit of
$6.5 billion with 54 rms and banks, which were used to support
commercial paper. The committed lines of credit mature at varying
times starting between June 2008 and June 2011, carry interest
rates of LIBOR plus 11 to 13 basis points and at prime plus zero to
50 basis points, and incur commitment fees of 2 to 7.5 basis points
on undrawn amounts.
Long-term debt at January 31, consists of (in millions):
Interest Rate Due by Fiscal Year 2007 2006
1.200 – 6.875% Notes due 2010 $ 4,614 $ 4,527
5.250% Notes due 2036 4,465 4,279
0.310 – 9.200%,
LIBOR less 0.10% Notes due 2009 4,372 2,800
0.1838 – 10.880% Notes due 2011(1) 3,292 3,308
2.875 – 13.750%,
LIBOR less 0.1025% Notes due 2008 3,141 3,311
0.750 – 7.250% Notes due 2014 2,970 2,885
1.200 – 4.125% Notes due 2012 2,426 2,015
5.750 – 7.550% Notes due 2031 1,983 1,890
4.875% Notes due 2039 1,966 –
5.502% Notes due 2027(1) 1,000 –
3.150 – 6.630% Notes due 2016 769 767
2.950 – 5.006% Notes due 2019(1) 515 516
6.750% Notes due 2024 250 266
2.100 – 2.875% Notes due 2015 45 53
2.000 – 2.500% Notes due 2017 37 41
3.750 – 5.000% Notes due 2018 28 31
1.600 – 2.300% Notes due 2013 18 23
1.100 – 13.250%,
LIBOR less 0.140% Notes due 2007 – 3,415
5.170% Notes due 2021 – 25
Other(2) 759 872
Total $32,650 $31,024
(1) Notes due in 2011 and 2019 both include $500 million put options.
Notes due in 2027 include $1.0 billion put options.
(2) Includes adjustments to debt hedged by derivatives.
The Company has $2.0 billion in debt with embedded put options.
The holders of one $500 million debt issuance may require the
Company to repurchase the debt at par plus accrued interest at any
time. Two issues of money market puttable reset securities, one in the
amount of $500 million and the second in the amount of $1.0 billion,
are structured to be remarketed in connection with the annual reset
of the interest rate. If, for any reason, the remarketing of the notes does
not occur at the time of any interest rate reset, the holders of the
notes must sell, and the Company must repurchase, the notes at par.
All of these issuances have been classi ed as long-term debt due
within one year in the Consolidated Balance Sheets.
Notes to Consolidated Financial Statements