Walmart 2007 Annual Report Download - page 43
Download and view the complete annual report
Please find page 43 of the 2007 Walmart annual report below. You can navigate through the pages in the report by either clicking on the pages listed below, or by using the keyword search tool below to find specific information within the annual report.-
 1
1 -
2
-
3
-
4
-
5
-
6
-
7
-
8
-
9
-
10
-
11
-
12
-
13
-
14
-
15
-
16
-
17
-
18
-
19
-
20
-
21
-
22
-
23
-
24
-
25
-
26
-
27
-
28
-
29
-
30
-
31
-
32
-
 33
33 -
 34
34 -
 35
35 -
 36
36 -
 37
37 -
 38
38 -
 39
39 -
 40
40 -
 41
41 -
 42
42 -
 43
43 -
 44
44 -
 45
45 -
 46
46 -
 47
47 -
 48
48 -
 49
49 -
 50
50 -
 51
51 -
 52
52 -
 53
53 -
54
-
55
-
56
-
57
-
58
-
59
-
60
-
61
-
62
-
63
-
64
-
65
-
66
-
67
-
68
 |
 |

Wal-Mart 2007 Annual Report 41
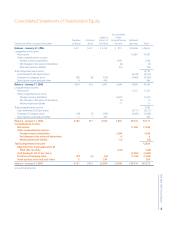
Consolidated Statements of Shareholders’ Equity
Accumulated
Capital in Other
Number Common Excess of Comprehensive Retained
(Amounts in millions except per share data) of Shares Stock Par Value Income Earnings Total
Balance – January 31, 2004 4,311 $ 431 $ 2,135 $ 851 $ 40,206 $ 43,623
Comprehensive income:
Net income 10,267 10,267
Other comprehensive income:
Foreign currency translation 1,938 1,938
Net changes in fair values of derivatives (2) (2)
Minimum pension liability (93) (93)
Total comprehensive income 12,110
Cash dividends ($0.52 per share) (2,214) (2,214)
Purchase of Company stock (81) (8) (136) (4,405) (4,549)
Stock options exercised and other 4 426 426
Balance – January 31, 2005 4,234 423 2,425 2,694 43,854 49,396
Comprehensive income:
Net income 11,231 11,231
Other comprehensive income:
Foreign currency translation (1,691) (1,691)
Net changes in fair values of derivatives (1) (1)
Minimum pension liability 51 51
Total comprehensive income 9,590
Cash dividends ($0.60 per share) (2,511) (2,511)
Purchase of Company stock (74) (7) (104) (3,469) (3,580)
Stock options exercised and other 5 1 275 276
Balance – January 31, 2006 4,165 417 2,596 1,053 49,105 53,171
Comprehensive income:
Net income 11,284 11,284
Other comprehensive income:
Foreign currency translation 1,584 1,584
Net changes in fair values of derivatives 6 6
Minimum pension liability (15) (15)
Total comprehensive income 12,859
Adjustment for initial application of
SFAS 158, net of tax (120) (120)
Cash dividends ($0.67 per share) (2,802) (2,802)
Purchase of Company stock (39) (4) (52) (1,769) (1,825)
Stock options exercised and other 5 290 290
Balance – January 31, 2007 4,131 $413 $2,834 $2,508 $55,818 $61,573
See accompanying notes.