American Express 2015 Annual Report Download - page 141
Download and view the complete annual report
Please find page 141 of the 2015 American Express annual report below. You can navigate through the pages in the report by either clicking on the pages listed below, or by using the keyword search tool below to find specific information within the annual report.-
 1
1 -
2
-
3
-
4
-
5
-
6
-
7
-
8
-
9
-
10
-
11
-
12
-
13
-
14
-
15
-
16
-
17
-
18
-
19
-
20
-
21
-
22
-
23
-
24
-
25
-
26
-
27
-
28
-
29
-
30
-
31
-
32
-
33
-
34
-
35
-
36
-
37
-
38
-
39
-
40
-
41
-
42
-
43
-
44
-
45
-
46
-
47
-
48
-
49
-
50
-
51
-
52
-
53
-
54
-
55
-
56
-
57
-
58
-
59
-
60
-
61
-
62
-
63
-
64
-
65
-
66
-
67
-
68
-
69
-
70
-
71
-
72
-
73
-
74
-
75
-
76
-
77
-
78
-
79
-
80
-
81
-
82
-
83
-
84
-
85
-
86
-
87
-
88
-
89
-
90
-
91
-
92
-
93
-
94
-
95
-
96
-
97
-
98
-
99
-
100
-
101
-
102
-
103
-
104
-
105
-
106
-
107
-
108
-
109
-
110
-
111
-
112
-
113
-
114
-
115
-
116
-
117
-
118
-
119
-
120
-
121
-
122
-
123
-
124
-
125
-
126
-
127
-
128
-
129
-
130
-
 131
131 -
 132
132 -
 133
133 -
 134
134 -
 135
135 -
 136
136 -
 137
137 -
 138
138 -
 139
139 -
 140
140 -
 141
141 -
 142
142 -
 143
143 -
 144
144 -
 145
145 -
 146
146 -
 147
147 -
 148
148 -
 149
149 -
 150
150 -
 151
151 -
152
-
153
-
154
-
155
-
156
-
157
-
158
-
159
-
160
-
161
-
162
-
163
-
164
-
165
-
166
-
167
-
168
-
169
-
170
-
171
-
172
-
173
-
174
-
175
-
176
-
177
-
178
-
179
-
180
-
181
-
182
-
183
-
184
-
185
-
186
-
187
-
188
-
189
-
190
-
191
-
192
-
193
-
194
-
195
-
196
 |
 |

NOTE 11
STOCK PLANS
STOCK OPTION AND AWARD PROGRAMS
Under the 2007 Incentive Compensation Plan and previously under the 1998 Incentive Compensation Plan,
awards may be granted to employees and other key individuals who perform services for the Company and its
participating subsidiaries. These awards may be in the form of stock options, restricted stock awards or units (RSAs),
portfolio grants (PGs) or other incentives, and similar awards designed to meet the requirements of non-U.S.
jurisdictions.
For the Company’s Incentive Compensation Plans, there were a total of 33 million common shares unissued and
available for grant as of December 31, 2015, and 35 million common shares unissued and available for grant as of
December 31, 2014 and 2013, as authorized by the Company’s Board of Directors and shareholders.
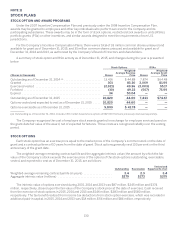
A summary of stock option and RSA activity as of December 31, 2015, and changes during the year is presented
below:
Stock Options RSAs
(Shares in thousands) Shares
Weighted-
Average Exercise
Price Shares
Weighted-
Average Grant
Price
Outstanding as of December 31, 2014 (a) ........................ 13,416 $ 44.88 7,874 $64.48
Granted .................................................... 301 83.30 3,069 81.99
Exercised/vested ........................................... (2,921) 49.96 (3,003) 55.17
Forfeited ................................................... (10) 49.22 (507) 75.99
Expired .................................................... 34 50.04 — —
Outstanding as of December 31, 2015 .......................... 10,820 44.60 7,433 $74.67
Options vested and expected to vest as of December 31, 2015 ..... 10,820 44.60 — —
Options exercisable as of December 31, 2015 .................... 9,809 $ 41.78 — —
(a) Outstanding as of December 31, 2014, includes CEO market-based stock options of 687,000 that were previously disclosed separately.
The Company recognizes the cost of employee stock awards granted in exchange for employee services based on
the grant-date fair value of the award, net of expected forfeitures. Those costs are recognized ratably over the vesting
period.
STOCK OPTIONS
Each stock option has an exercise price equal to the market price of the Company’s common stock on the date of
grant and a contractual term of 10 years from the date of grant. Stock options generally vest 100 percent on the third
anniversary of the grant date.
The weighted-average remaining contractual life and the aggregate intrinsic value (the amount by which the fair
value of the Company’s stock exceeds the exercise price of the option) of the stock options outstanding, exercisable,
vested, and expected to vest as of December 31, 2015, are as follows:
Outstanding Exercisable Vested and
Expected to Vest
Weighted-average remaining contractual life (in years) ................... 3.4 2.9 3.4
Aggregate intrinsic value (millions) .................................... $279 $273 $279
The intrinsic value of options exercised during 2015, 2014 and 2013 was $87 million, $245 million and $374
million, respectively, (based upon the fair value of the Company’s stock price at the date of exercise). Cash received
from the exercise of stock options in 2015, 2014 and 2013 was $146 million, $283 million and $580 million,
respectively. The tax benefit realized from income tax deductions from stock option exercises, which was recorded in
additional paid-in capital, in 2015, 2014 and 2013 was $18 million, $54 million and $84 million, respectively.
130