American Express 2015 Annual Report Download - page 142
Download and view the complete annual report
Please find page 142 of the 2015 American Express annual report below. You can navigate through the pages in the report by either clicking on the pages listed below, or by using the keyword search tool below to find specific information within the annual report.-
 1
1 -
2
-
3
-
4
-
5
-
6
-
7
-
8
-
9
-
10
-
11
-
12
-
13
-
14
-
15
-
16
-
17
-
18
-
19
-
20
-
21
-
22
-
23
-
24
-
25
-
26
-
27
-
28
-
29
-
30
-
31
-
32
-
33
-
34
-
35
-
36
-
37
-
38
-
39
-
40
-
41
-
42
-
43
-
44
-
45
-
46
-
47
-
48
-
49
-
50
-
51
-
52
-
53
-
54
-
55
-
56
-
57
-
58
-
59
-
60
-
61
-
62
-
63
-
64
-
65
-
66
-
67
-
68
-
69
-
70
-
71
-
72
-
73
-
74
-
75
-
76
-
77
-
78
-
79
-
80
-
81
-
82
-
83
-
84
-
85
-
86
-
87
-
88
-
89
-
90
-
91
-
92
-
93
-
94
-
95
-
96
-
97
-
98
-
99
-
100
-
101
-
102
-
103
-
104
-
105
-
106
-
107
-
108
-
109
-
110
-
111
-
112
-
113
-
114
-
115
-
116
-
117
-
118
-
119
-
120
-
121
-
122
-
123
-
124
-
125
-
126
-
127
-
128
-
129
-
130
-
131
-
 132
132 -
 133
133 -
 134
134 -
 135
135 -
 136
136 -
 137
137 -
 138
138 -
 139
139 -
 140
140 -
 141
141 -
 142
142 -
 143
143 -
 144
144 -
 145
145 -
 146
146 -
 147
147 -
 148
148 -
 149
149 -
 150
150 -
 151
151 -
 152
152 -
153
-
154
-
155
-
156
-
157
-
158
-
159
-
160
-
161
-
162
-
163
-
164
-
165
-
166
-
167
-
168
-
169
-
170
-
171
-
172
-
173
-
174
-
175
-
176
-
177
-
178
-
179
-
180
-
181
-
182
-
183
-
184
-
185
-
186
-
187
-
188
-
189
-
190
-
191
-
192
-
193
-
194
-
195
-
196
 |
 |

The fair value of each option is estimated on the date of grant using a Black-Scholes-Merton option-pricing model.
The following weighted-average assumptions were used for options granted in 2015, 2014 and 2013, the majority of
which were options granted in the beginning of each year:
2015 2014 2013
Dividend yield .............................................................. 1.1% 1.1% 1.4%
Expected volatility (a) ........................................................ 37% 38% 39%
Risk-free interest rate ....................................................... 1.7% 2.2% 1.3%
Expected life of stock option (in years) (b) ....................................... 6.7 6.7 6.3
Weighted-average fair value per option ........................................ $29.20 $32.36 $21.11
(a) The expected volatility is based on both weighted historical and implied volatilities of the Company’s common stock price.
(b) In 2015, 2014 and 2013, the expected life of stock options was determined using both historical data and expectations of option exercise
behavior.
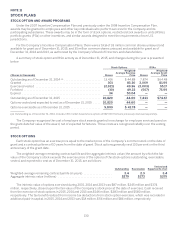
RESTRICTED STOCK AWARDS
RSAs are valued based on the stock price on the date of grant, contain either a) service conditions or b) both
service and performance conditions, and generally vest 25 percent per year beginning with the first anniversary of the
grant date. RSAs containing both service and performance conditions generally vest on the third anniversary of the
grant date, and the number of shares earned depends on the achievement of predetermined Company metrics. All
RSA holders receive non-forfeitable dividends or dividend equivalents. The total fair value of shares vested during
2015, 2014 and 2013 was $247 million, $298 million and $336 million, respectively (based upon the Company’s stock
price at the vesting date).
The weighted-average grant date fair value of RSAs granted in 2015, 2014 and 2013, is $81.99, $86.65 and $60.13,
respectively.
LIABILITY-BASED AWARDS
Certain employees are awarded PGs and other incentive awards that can be settled with cash or equity shares at
the Company’s discretion and final Compensation and Benefits Committee payout approval. These awards earn value
based on performance, market and service conditions, and vest over periods of one to three years.
PGs and other incentive awards are generally settled with cash and thus are classified as liabilities; therefore, the
fair value is determined at the date of grant and remeasured quarterly as part of compensation expense over the
vesting period. Cash paid upon vesting of these awards in 2015, 2014 and 2013 was $74 million, $62 million and $43
million, respectively.
Summary of Stock Plan Expense
The components of the Company’s total stock-based compensation expense (net of forfeitures) for the years
ended December 31, are as follows:
(Millions) 2015 2014 2013
Restricted stock awards (a) ............................................................ $190 $ 193 $208
Stock options (a) ..................................................................... 12 13 23
Liability-based awards ............................................................... 32 84 119
Total stock-based compensation expense (b) ............................................ $234 $290 $350
(a) As of December 31, 2015, the total unrecognized compensation cost related to unvested RSAs and options of $214 million and $3 million,
respectively, will be recognized ratably over the weighted-average remaining vesting period of 2.1 years and 1.2 years, respectively.
(b) The total income tax benefit recognized in the Consolidated Statements of Income for stock-based compensation arrangements for the years
ended December 31, 2015, 2014 and 2013 was $83 million, $104 million and $127 million, respectively.
131