American Express 2015 Annual Report Download - page 99
Download and view the complete annual report
Please find page 99 of the 2015 American Express annual report below. You can navigate through the pages in the report by either clicking on the pages listed below, or by using the keyword search tool below to find specific information within the annual report.-
 1
1 -
2
-
3
-
4
-
5
-
6
-
7
-
8
-
9
-
10
-
11
-
12
-
13
-
14
-
15
-
16
-
17
-
18
-
19
-
20
-
21
-
22
-
23
-
24
-
25
-
26
-
27
-
28
-
29
-
30
-
31
-
32
-
33
-
34
-
35
-
36
-
37
-
38
-
39
-
40
-
41
-
42
-
43
-
44
-
45
-
46
-
47
-
48
-
49
-
50
-
51
-
52
-
53
-
54
-
55
-
56
-
57
-
58
-
59
-
60
-
61
-
62
-
63
-
64
-
65
-
66
-
67
-
68
-
69
-
70
-
71
-
72
-
73
-
74
-
75
-
76
-
77
-
78
-
79
-
80
-
81
-
82
-
83
-
84
-
85
-
86
-
87
-
88
-
 89
89 -
 90
90 -
 91
91 -
 92
92 -
 93
93 -
 94
94 -
 95
95 -
 96
96 -
 97
97 -
 98
98 -
 99
99 -
 100
100 -
 101
101 -
 102
102 -
 103
103 -
 104
104 -
 105
105 -
 106
106 -
 107
107 -
 108
108 -
 109
109 -
110
-
111
-
112
-
113
-
114
-
115
-
116
-
117
-
118
-
119
-
120
-
121
-
122
-
123
-
124
-
125
-
126
-
127
-
128
-
129
-
130
-
131
-
132
-
133
-
134
-
135
-
136
-
137
-
138
-
139
-
140
-
141
-
142
-
143
-
144
-
145
-
146
-
147
-
148
-
149
-
150
-
151
-
152
-
153
-
154
-
155
-
156
-
157
-
158
-
159
-
160
-
161
-
162
-
163
-
164
-
165
-
166
-
167
-
168
-
169
-
170
-
171
-
172
-
173
-
174
-
175
-
176
-
177
-
178
-
179
-
180
-
181
-
182
-
183
-
184
-
185
-
186
-
187
-
188
-
189
-
190
-
191
-
192
-
193
-
194
-
195
-
196
 |
 |

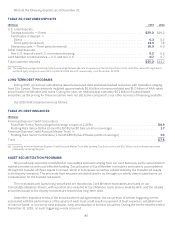
Our interest rate exposure can vary over time as a result of, among other things, the proportion of our total
funding provided by variable-and fixed-rate debt and deposits compared to our Card Member loans and receivables.
Interest rate swaps are used from time to time to effectively convert debt issuances to (or from) variable-rate, from (or
to) fixed-rate. We do not engage in derivative financial instruments for trading purposes. Refer to Note 14 to the
Consolidated Financial Statements for further discussion of our derivative financial instruments.
We analyze a variety of interest rate scenarios to inform us of the potential impacts from interest rate changes on
earnings and the value of assets, liabilities and the economic value of equity. As of December 31, 2015, the detrimental
effect on our annual net interest income of a hypothetical, immediate 100 basis point increase in interest rates would
be approximately $216 million. To calculate this effect, the projected net interest income over a 12-month time horizon
is measured, considering forecasted business growth and future interest rates. The change in projected net interest
income from a 100 basis point increase in rates is measured by increasing our forecast of future interest rates by 100
basis points. The timing and loan balances associated with the sales of the HFS loan portfolios are key assumptions in
projecting business growth this year. The HFS loan portfolio sales, if and when completed, are expected to reduce our
exposure to rising interest rates, all else remaining constant.
We are also subject to market risk from changes in the relationship between the benchmark Prime rate that
determines the yield on our variable-rate lending receivables and the benchmark LIBOR rate that determines the
effective interest cost on a significant portion of our outstanding debt. Differences in the rate of change of these two
indices, commonly referred to as basis risk, would impact our variable-rate U.S. lending net interest margins because
we borrow at rates based on LIBOR but lend to our customers based on the Prime rate. The detrimental effect on our
net interest income of a hypothetical 10 basis point decrease in the spread between Prime and one-month LIBOR over
the next 12 months is estimated to be $35 million. We currently have approximately $40 billion of Prime-based,
variable-rate U.S. lending receivables and $35 billion of LIBOR-indexed debt, including asset securitizations. The HFS
loan portfolios sales are expected to reduce our basis risk exposure, all else remaining constant.
Foreign exchange exposures arise in four principal ways: 1) Card Member spending in currencies that are not the
billing currency, 2) cross-currency transactions and balances from our funding activities, 3) cross-currency investing
activities, such as in the equity of foreign subsidiaries, and 4) revenues generated and expenses incurred in foreign
currencies, which impact earnings.
These foreign exchange risks are managed primarily by entering into foreign exchange spot transactions or
hedged with foreign exchange forward contracts when the hedge costs are economically justified and in notional
amounts designed to offset pre-tax impacts from currency movements in the period in which they occur. As of
December 31, 2015 and 2014, foreign currency derivative instruments with total notional amounts of approximately
$26 billion and $30 billion were outstanding, respectively.
With respect to Card Member spending and cross-currency transactions, including related foreign exchange
forward contracts outstanding, a hypothetical 10 percent strengthening of the U.S. dollar would result in an immaterial
impact to projected earnings as of December 31, 2015. With respect to translation exposure of foreign subsidiary
equity balances, including related foreign exchange forward contracts outstanding, a hypothetical 10 percent
strengthening of the U.S. dollar would result in an immaterial reduction in other comprehensive income and equity as
of December 31, 2015. With respect to earnings denominated in foreign currencies, the adverse impact on pretax
income of a hypothetical 10 percent strengthening of the U.S. dollar related to anticipated overseas operating results
for the next 12 months would be approximately $179 million as of December 31, 2015.
The actual impact of interest rate and foreign exchange rate changes will depend on, among other factors, the timing of
rate changes, the extent to which different rates do not move in the same direction or in the same direction to the same
degree, changes in the cost, volume and mix of our hedging activities and changes in the volume and mix of our businesses.
FUNDING & LIQUIDITY RISK MANAGEMENT PROCESS
Liquidity risk is defined as our inability to meet our ongoing financial and business obligations as they become due
at a reasonable cost.
Our Board-approved Liquidity Risk Policy establishes the framework that guides and governs liquidity risk
management.
Liquidity risk is managed by the Funding and Liquidity Committee. In addition, the Market Risk Oversight Officer
provides independent oversight of liquidity risk management. We manage liquidity risk by maintaining access to a
diverse set of cash, readily-marketable securities and contingent sources of liquidity, such that we can continuously
meet our business requirements and expected future financing obligations for at least a 12-month period, even in the
event we are unable to raise new funds under our regular funding programs during a substantial weakening in
economic conditions. We consider the trade-offs between maintaining too much liquidity, which can be costly and limit
financial flexibility, and having inadequate liquidity, which may result in financial distress during a liquidity event.
88