American Express 2015 Annual Report Download - page 88
Download and view the complete annual report
Please find page 88 of the 2015 American Express annual report below. You can navigate through the pages in the report by either clicking on the pages listed below, or by using the keyword search tool below to find specific information within the annual report.-
 1
1 -
2
-
3
-
4
-
5
-
6
-
7
-
8
-
9
-
10
-
11
-
12
-
13
-
14
-
15
-
16
-
17
-
18
-
19
-
20
-
21
-
22
-
23
-
24
-
25
-
26
-
27
-
28
-
29
-
30
-
31
-
32
-
33
-
34
-
35
-
36
-
37
-
38
-
39
-
40
-
41
-
42
-
43
-
44
-
45
-
46
-
47
-
48
-
49
-
50
-
51
-
52
-
53
-
54
-
55
-
56
-
57
-
58
-
59
-
60
-
61
-
62
-
63
-
64
-
65
-
66
-
67
-
68
-
69
-
70
-
71
-
72
-
73
-
74
-
75
-
76
-
77
-
 78
78 -
 79
79 -
 80
80 -
 81
81 -
 82
82 -
 83
83 -
 84
84 -
 85
85 -
 86
86 -
 87
87 -
 88
88 -
 89
89 -
 90
90 -
 91
91 -
 92
92 -
 93
93 -
 94
94 -
 95
95 -
 96
96 -
 97
97 -
 98
98 -
99
-
100
-
101
-
102
-
103
-
104
-
105
-
106
-
107
-
108
-
109
-
110
-
111
-
112
-
113
-
114
-
115
-
116
-
117
-
118
-
119
-
120
-
121
-
122
-
123
-
124
-
125
-
126
-
127
-
128
-
129
-
130
-
131
-
132
-
133
-
134
-
135
-
136
-
137
-
138
-
139
-
140
-
141
-
142
-
143
-
144
-
145
-
146
-
147
-
148
-
149
-
150
-
151
-
152
-
153
-
154
-
155
-
156
-
157
-
158
-
159
-
160
-
161
-
162
-
163
-
164
-
165
-
166
-
167
-
168
-
169
-
170
-
171
-
172
-
173
-
174
-
175
-
176
-
177
-
178
-
179
-
180
-
181
-
182
-
183
-
184
-
185
-
186
-
187
-
188
-
189
-
190
-
191
-
192
-
193
-
194
-
195
-
196
 |
 |

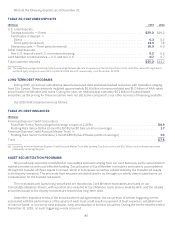
The following table presents a comparison of our Common Equity Tier 1 and Tier 1 risk-based capital under
Transitional Basel III rules to our estimated Common Equity Tier 1 and Tier 1 risk-based capital under Fully Phased-in
Basel III rules as of December 31, 2015.
TABLE 20: TRANSITIONAL BASEL III VERSUS FULLY PHASED-IN BASEL III
(Billions) CET1 Tier 1
Risk-Based Capital under Transitional Basel III ................................................. $16.7 $18.3
Adjustments related to:
AOCI ................................................................................. (0.3) (0.3)
Transition provisions for intangible assets ................................................. (0.5) (0.5)
Deferred tax assets ..................................................................... (0.1) (0.1)
Other ................................................................................... 0.1 0.1
Estimated Common Equity Tier 1 (CET1) and Tier 1 Risk-Based Capital under Fully Phased-in
Basel III ................................................................................. $15.9 $17.5
Fully Phased-in Basel III Risk-Weighted Assets — The Fully Phased-in Basel III risk-weighted assets reflect our
Basel III risk-weighted assets, with all transition provisions fully phased in. This includes incremental risk weighting
applied to deferred tax assets and significant investments in unconsolidated financial institutions, as well as exposures
to past due accounts, equities and sovereigns. The Fully Phased-in Basel III risk-weighted assets as of December 31,
2015 were estimated to be $135.0 billion.
Fully Phased-in Basel III Tier 1 Leverage Ratio — The Fully Phased-in Basel III Tier 1 leverage ratio is calculated by
dividing Fully Phased-in Basel III Tier 1 capital by our average total consolidated assets.
Basel III Supplementary Leverage Ratio — The supplementary leverage ratio under Fully Phased-in Basel III rules is
calculated by dividing Fully Phased-in Basel III Tier 1 capital by our total assets for supplementary leverage capital
purposes under Basel III. Total assets for supplementary leverage capital purposes reflect total consolidated assets
with adjustments for Tier 1 capital deductions, off-balance sheet derivatives, undrawn unconditionally cancellable
commitments and other off-balance sheet liabilities. Total assets for supplementary leverage capital purposes as of
December 31, 2015 were estimated to be $186.1 billion.
SHARE REPURCHASES AND DIVIDENDS
We return capital to common shareholders through dividends and share repurchases. The share repurchases
reduce common shares outstanding and more than offset the issuance of new shares as part of employee
compensation plans.
During the year ended December 31, 2015, we returned $5.6 billion to our shareholders in the form of common
stock dividends ($1.1 billion) and share repurchases ($4.5 billion). We repurchased 58.8 million common shares at an
average price of $76.70 in 2015. These dividend and share repurchase amounts represent approximately 105 percent
of total capital generated during the year. The amount of capital we generated in 2015 significantly exceeded the
capital required to finance organic business growth and acquisitions. The proposed sales of the HFS loan portfolios are
expected to, all else remaining constant, increase our capital ratios due to the reduction in risk-weighted assets. This
additional capital flexibility may be used to support growth in loans, potential acquisitions, distributions to
shareholders, or a combination thereof. Beginning in 2016, participating CCAR firms are now required to submit their
capital plans and stress testing results to the Federal Reserve on or before April 5 of each year instead of on or before
January 5 of each year as previously required. The Federal Reserve is expected to publish the decisions for all the bank
holding companies participating in CCAR 2016, including the reasons for any objection to capital plans, by June 30,
2016.
In addition, during the year ended December 31, 2015, we had $750 million of non-cumulative perpetual preferred
shares (the “Series B Preferred Shares”) and $850 million of non-cumulative perpetual preferred shares (the “Series
C Preferred Shares”) outstanding. Dividends declared and paid on Series B and Series C Preferred Shares during 2015
were $40 million and $22 million, respectively. For additional information on our preferred shares refer to Note 17
“Common and Preferred Shares” and Note 22 “Earnings per Common Share (EPS); Preferred Shares” of the
“Consolidated Financial Statements.”
77