American Express 2015 Annual Report Download - page 149
Download and view the complete annual report
Please find page 149 of the 2015 American Express annual report below. You can navigate through the pages in the report by either clicking on the pages listed below, or by using the keyword search tool below to find specific information within the annual report.-
 1
1 -
2
-
3
-
4
-
5
-
6
-
7
-
8
-
9
-
10
-
11
-
12
-
13
-
14
-
15
-
16
-
17
-
18
-
19
-
20
-
21
-
22
-
23
-
24
-
25
-
26
-
27
-
28
-
29
-
30
-
31
-
32
-
33
-
34
-
35
-
36
-
37
-
38
-
39
-
40
-
41
-
42
-
43
-
44
-
45
-
46
-
47
-
48
-
49
-
50
-
51
-
52
-
53
-
54
-
55
-
56
-
57
-
58
-
59
-
60
-
61
-
62
-
63
-
64
-
65
-
66
-
67
-
68
-
69
-
70
-
71
-
72
-
73
-
74
-
75
-
76
-
77
-
78
-
79
-
80
-
81
-
82
-
83
-
84
-
85
-
86
-
87
-
88
-
89
-
90
-
91
-
92
-
93
-
94
-
95
-
96
-
97
-
98
-
99
-
100
-
101
-
102
-
103
-
104
-
105
-
106
-
107
-
108
-
109
-
110
-
111
-
112
-
113
-
114
-
115
-
116
-
117
-
118
-
119
-
120
-
121
-
122
-
123
-
124
-
125
-
126
-
127
-
128
-
129
-
130
-
131
-
132
-
133
-
134
-
135
-
136
-
137
-
138
-
 139
139 -
 140
140 -
 141
141 -
 142
142 -
 143
143 -
 144
144 -
 145
145 -
 146
146 -
 147
147 -
 148
148 -
 149
149 -
 150
150 -
 151
151 -
 152
152 -
 153
153 -
 154
154 -
 155
155 -
 156
156 -
 157
157 -
 158
158 -
 159
159 -
160
-
161
-
162
-
163
-
164
-
165
-
166
-
167
-
168
-
169
-
170
-
171
-
172
-
173
-
174
-
175
-
176
-
177
-
178
-
179
-
180
-
181
-
182
-
183
-
184
-
185
-
186
-
187
-
188
-
189
-
190
-
191
-
192
-
193
-
194
-
195
-
196
 |
 |

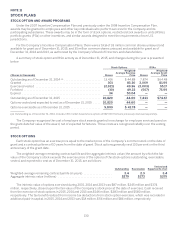
NOTE 15
FAIR VALUES
Fair value is defined as the price that would be required to sell an asset or paid to transfer a liability in an orderly
transaction between market participants at the measurement date, based on the Company’s principal or, in the
absence of a principal, most advantageous market for the specific asset or liability.
GAAP provides for a three-level hierarchy of inputs to valuation techniques used to measure fair value, defined as
follows:
• Level 1 — Inputs that are quoted prices (unadjusted) for identical assets or liabilities in active markets that the
entity can access.
• Level 2 — Inputs other than quoted prices included within Level 1 that are observable for the asset or liability,
either directly or indirectly, for substantially the full term of the asset or liability, including:
• Quoted prices for similar assets or liabilities in active markets;
• Quoted prices for identical or similar assets or liabilities in markets that are not active;
• Inputs other than quoted prices that are observable for the asset or liability; and
• Inputs that are derived principally from or corroborated by observable market data by correlation or other
means.
• Level 3 — Inputs that are unobservable and reflect the Company’s own estimates about the estimates market
participants would use in pricing the asset or liability based on the best information available in the
circumstances (e.g., internally derived assumptions surrounding the timing and amount of expected cash
flows). The Company did not measure any financial instruments presented on the Consolidated Balance Sheets
at fair value on a recurring basis using significant unobservable inputs (Level 3) during the years ended
December 31, 2015 and 2014, although the disclosed fair value of certain assets that are not carried at fair value,
as presented later in this Note, are classified within Level 3.
The Company monitors the market conditions and evaluates the fair value hierarchy levels at least quarterly. For
any transfers in and out of the levels of the fair value hierarchy, the Company discloses the fair value measurement at
the beginning of the reporting period during which the transfer occurred. For the years ended December 31, 2015 and
2014, there were no significant transfers between levels.
FINANCIAL ASSETS AND FINANCIAL LIABILITIES CARRIED AT FAIR VALUE
The following table summarizes the Company’s financial assets and financial liabilities measured at fair value on a
recurring basis, categorized by GAAP’s valuation hierarchy (as described in the preceding paragraphs), as of
December 31:
2015 2014
(Millions) Total Level 1 Level 2 Level 3 Total Level 1 Level 2 Level 3
Assets:
Investment securities: (a)
Equity securities ....................... $1$1$—$—$1$1$—$—
Debt securities and other ................ 3,758 409 3,349 — 4,430 350 4,080 —
Derivatives (a) ............................ 544 — 545 — 991 — 991 —
Total assets ............................. 4,303 410 3,894 — 5,422 351 5,071 —
Liabilities:
Derivatives (a) ............................ 201 — 201 — 164 — 164 —
Total liabilities ........................... $ 201 $ — $ 201 $— $ 164 $ — $ 164 $—
(a) Refer to Note 5 for the fair values of investment securities and to Note 14 for the fair values of derivative assets and liabilities, on a further
disaggregated basis.
138