American Express 2015 Annual Report Download - page 81
Download and view the complete annual report
Please find page 81 of the 2015 American Express annual report below. You can navigate through the pages in the report by either clicking on the pages listed below, or by using the keyword search tool below to find specific information within the annual report.-
 1
1 -
2
-
3
-
4
-
5
-
6
-
7
-
8
-
9
-
10
-
11
-
12
-
13
-
14
-
15
-
16
-
17
-
18
-
19
-
20
-
21
-
22
-
23
-
24
-
25
-
26
-
27
-
28
-
29
-
30
-
31
-
32
-
33
-
34
-
35
-
36
-
37
-
38
-
39
-
40
-
41
-
42
-
43
-
44
-
45
-
46
-
47
-
48
-
49
-
50
-
51
-
52
-
53
-
54
-
55
-
56
-
57
-
58
-
59
-
60
-
61
-
62
-
63
-
64
-
65
-
66
-
67
-
68
-
69
-
70
-
 71
71 -
 72
72 -
 73
73 -
 74
74 -
 75
75 -
 76
76 -
 77
77 -
 78
78 -
 79
79 -
 80
80 -
 81
81 -
 82
82 -
 83
83 -
 84
84 -
 85
85 -
 86
86 -
 87
87 -
 88
88 -
 89
89 -
 90
90 -
 91
91 -
92
-
93
-
94
-
95
-
96
-
97
-
98
-
99
-
100
-
101
-
102
-
103
-
104
-
105
-
106
-
107
-
108
-
109
-
110
-
111
-
112
-
113
-
114
-
115
-
116
-
117
-
118
-
119
-
120
-
121
-
122
-
123
-
124
-
125
-
126
-
127
-
128
-
129
-
130
-
131
-
132
-
133
-
134
-
135
-
136
-
137
-
138
-
139
-
140
-
141
-
142
-
143
-
144
-
145
-
146
-
147
-
148
-
149
-
150
-
151
-
152
-
153
-
154
-
155
-
156
-
157
-
158
-
159
-
160
-
161
-
162
-
163
-
164
-
165
-
166
-
167
-
168
-
169
-
170
-
171
-
172
-
173
-
174
-
175
-
176
-
177
-
178
-
179
-
180
-
181
-
182
-
183
-
184
-
185
-
186
-
187
-
188
-
189
-
190
-
191
-
192
-
193
-
194
-
195
-
196
 |
 |

EXPENSES
Marketing, promotion, rewards, Card Member services and other expenses decreased $50 million or 7 percent in
2015 compared to 2014, primarily driven by lower Card Member rewards due to lower spending volumes and a $13
million charge related to the Delta partnership renewal in the fourth quarter of 2014.
Salaries and employee benefits and other operating expenses decreased $189 million or 11 percent in 2015
compared to 2014, primarily due to the impact of the business travel joint venture transaction (resulting in a lack of
comparability between periods), partially offset by elevated level of spending on growth initiatives in 2015.
Total expenses decreased $1.1 billion or 32 percent in 2014 compared to 2013, primarily due to the impact of the
business travel joint venture transaction (resulting in a lack of comparability between periods), including the gain
associated with the transaction in the second quarter of 2014, partially offset by transaction-related costs and
restructuring charges.
INCOME TAXES
The effective tax rate for 2015 reflects the impact of certain nondeductible foreign losses. The effective tax rate for
2013 reflects the reversal of a valuation allowance related to deferred tax assets associated with certain of our non-
U.S. business travel operations, as well as the allocated share of tax benefits related to the resolution of certain prior-
years’ tax items.
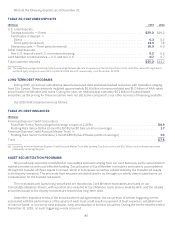
TABLE 14: GCS SELECTED STATISTICAL INFORMATION
As of or for the Years Ended December 31,
(Millions, except percentages and where indicated) 2015 2014 2013 Change
2015 vs. 2014 Change
2014 vs. 2013
Card billed business (billions) .................... $ 182.1 $ 186.7 $ 175.4 (2)% 6%
Total cards-in-force ............................. 6.9 6.9 7.1 — (3)
Basic cards-in-force ............................ 6.9 6.9 7.1 — (3)
Average basic Card Member spending (dollars)*.... $26,420 $26,706 $24,924 (1) 7
Total segment assets (billions) (a) ................. $ 17.7 $ 18.5 $ 19.2 (4) (4)
Segment capital ................................ $ 3,699 $ 3,782 $ 3,688 (2) 3
Return on average segment capital (b) ............. 17.4% 40.9% 23.6%
Return on average tangible segment capital (b) ...... 30.8% 74.4% 45.8%
Card Member receivables:
Total receivables (billions) ..................... $ 13.8 $ 14.6 $ 14.4 (5)% 1%
90 days past billing as a % of total .............. 0.9% 0.8% 0.9%
Net loss ratio (as a % of charge volume) ......... 0.09% 0.09% 0.08%
* Proprietary cards only.
(a) As of September 30, 2015, and prospectively, certain intercompany balances have been reclassified between operating segments, as a result of
systems enhancements.
(b) Return on average segment capital is calculated by dividing (i) one-year period segment income ($666 million, $1.5 billion and $860 million for
2015, 2014 and 2013, respectively) by (ii) one-year average segment capital ($3.8 billion for both 2015 and 2014 and $3.6 billion for 2013).
Return on average tangible segment capital, a non-GAAP measure, is computed in the same manner as return on average segment capital
except the computation excludes from average segment capital average goodwill and other intangibles of $1.7 billion at December 31, 2015 and
2014 and $1.8 billion at December 31, 2013. We believe return on average tangible segment capital is a useful measure of the profitability of our
business.
70