American Express 2015 Annual Report Download - page 85
Download and view the complete annual report
Please find page 85 of the 2015 American Express annual report below. You can navigate through the pages in the report by either clicking on the pages listed below, or by using the keyword search tool below to find specific information within the annual report.-
 1
1 -
2
-
3
-
4
-
5
-
6
-
7
-
8
-
9
-
10
-
11
-
12
-
13
-
14
-
15
-
16
-
17
-
18
-
19
-
20
-
21
-
22
-
23
-
24
-
25
-
26
-
27
-
28
-
29
-
30
-
31
-
32
-
33
-
34
-
35
-
36
-
37
-
38
-
39
-
40
-
41
-
42
-
43
-
44
-
45
-
46
-
47
-
48
-
49
-
50
-
51
-
52
-
53
-
54
-
55
-
56
-
57
-
58
-
59
-
60
-
61
-
62
-
63
-
64
-
65
-
66
-
67
-
68
-
69
-
70
-
71
-
72
-
73
-
74
-
 75
75 -
 76
76 -
 77
77 -
 78
78 -
 79
79 -
 80
80 -
 81
81 -
 82
82 -
 83
83 -
 84
84 -
 85
85 -
 86
86 -
 87
87 -
 88
88 -
 89
89 -
 90
90 -
 91
91 -
 92
92 -
 93
93 -
 94
94 -
 95
95 -
96
-
97
-
98
-
99
-
100
-
101
-
102
-
103
-
104
-
105
-
106
-
107
-
108
-
109
-
110
-
111
-
112
-
113
-
114
-
115
-
116
-
117
-
118
-
119
-
120
-
121
-
122
-
123
-
124
-
125
-
126
-
127
-
128
-
129
-
130
-
131
-
132
-
133
-
134
-
135
-
136
-
137
-
138
-
139
-
140
-
141
-
142
-
143
-
144
-
145
-
146
-
147
-
148
-
149
-
150
-
151
-
152
-
153
-
154
-
155
-
156
-
157
-
158
-
159
-
160
-
161
-
162
-
163
-
164
-
165
-
166
-
167
-
168
-
169
-
170
-
171
-
172
-
173
-
174
-
175
-
176
-
177
-
178
-
179
-
180
-
181
-
182
-
183
-
184
-
185
-
186
-
187
-
188
-
189
-
190
-
191
-
192
-
193
-
194
-
195
-
196
 |
 |

The following table presents our regulatory risk-based capital ratios and leverage ratios and those of our
significant bank subsidiaries, as well as additional ratios widely utilized in the marketplace, as of December 31, 2015.
TABLE 17: REGULATORY RISK-BASED CAPITAL AND LEVERAGE RATIOS
Basel III
Standards
2015 (a)
Ratios as of
December 31,
2015
Risk-Based Capital
Common Equity Tier 1 ............................................................ 4.5%
American Express Company ..................................................... 12.4%
American Express Centurion Bank ................................................ 16.9
American Express Bank, FSB .................................................... 13.7
Tier 1 ........................................................................... 6.0
American Express Company ..................................................... 13.5
American Express Centurion Bank ................................................ 16.9
American Express Bank, FSB .................................................... 13.7
Total ........................................................................... 8.0
American Express Company ..................................................... 15.2
American Express Centurion Bank ................................................ 18.2
American Express Bank, FSB .................................................... 15.1
Tier 1 Leverage ................................................................... 4.0
American Express Company ..................................................... 11.7
American Express Centurion Bank ................................................ 17.7
American Express Bank, FSB .................................................... 13.2
Supplementary Leverage Ratio (b) .................................................. 3.0%
American Express Company ..................................................... 9.8
American Express Centurion Bank ................................................ 14.1
American Express Bank, FSB .................................................... 10.0
Common Equity to Risk-Weighted Assets
American Express Company ..................................................... 14.1
Tangible Common Equity to Risk-Weighted Assets (c)
American Express Company ..................................................... 11.5%
(a) Transitional Basel III minimum and conservation buffer as defined by the Federal Reserve for calendar year 2015 for Advanced Approaches
institutions.
(b) The minimum supplementary leverage ratio (SLR) requirement of 3 percent is effective January 1, 2018.
(c) Tangible Common Equity to Risk-Weighted Assets, a non-GAAP measure, is calculated by dividing shareholders’ equity of $20.7 billion as of
December 31, 2015, less preferred shares of $1.6 billion and goodwill and other intangibles of $3.5 billion, by risk-weighted assets of $135.2
billion. We believe presenting the ratio of Tangible Common Equity to Risk-Weighted Assets is a useful measure of evaluating the strength of our
capital position. Tangible Common Equity to Risk-Weighted Assets ratio is widely used in the marketplace, although it may be calculated
differently by different companies.
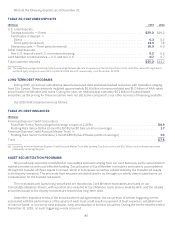
TABLE 18: REGULATORY RISK-BASED CAPITAL COMPONENTS AND RISK WEIGHTED ASSETS
($ in Billions) December 31,
2015
Risk-Based Capital
Common Equity Tier 1 ...................................................................... $ 16.7
Tier 1 Capital .............................................................................. 18.3
Tier 2 Capital (a) ............................................................................ 2.3
Total Capital .............................................................................. 20.6
Risk Weighted Assets ....................................................................... 135.2
Average Total Assets to calculate the Tier 1 Leverage Ratio ...................................... 156.4
Total Leverage Exposure to calculate SLR .................................................... $186.6
(a) Tier 2 capital is the sum of the allowance for receivable and loan losses (limited to 1.25 percent of risk-weighted assets), a portion of the
unrealized gains on equity securities, $600 million of subordinated notes issued in the fourth quarter of 2014 and $750 million of subordinated
debentures. The $750 million of subordinated debentures do not meet the requirements of Tier 2 capital under Basel III, and are being
transitioned out of capital (the total amount included in Tier 2 capital as of December 31, 2015, was $187 million). Hence, the total amount of
subordinated debt included in Tier 2 capital as of December 31, 2015, was $787 million. The $750 million of subordinated debentures have been
fully transitioned out of capital as of January 1, 2016.
74