American Express 2015 Annual Report Download - page 61
Download and view the complete annual report
Please find page 61 of the 2015 American Express annual report below. You can navigate through the pages in the report by either clicking on the pages listed below, or by using the keyword search tool below to find specific information within the annual report.-
 1
1 -
2
-
3
-
4
-
5
-
6
-
7
-
8
-
9
-
10
-
11
-
12
-
13
-
14
-
15
-
16
-
17
-
18
-
19
-
20
-
21
-
22
-
23
-
24
-
25
-
26
-
27
-
28
-
29
-
30
-
31
-
32
-
33
-
34
-
35
-
36
-
37
-
38
-
39
-
40
-
41
-
42
-
43
-
44
-
45
-
46
-
47
-
48
-
49
-
50
-
 51
51 -
 52
52 -
 53
53 -
 54
54 -
 55
55 -
 56
56 -
 57
57 -
 58
58 -
 59
59 -
 60
60 -
 61
61 -
 62
62 -
 63
63 -
 64
64 -
 65
65 -
 66
66 -
 67
67 -
 68
68 -
 69
69 -
 70
70 -
 71
71 -
72
-
73
-
74
-
75
-
76
-
77
-
78
-
79
-
80
-
81
-
82
-
83
-
84
-
85
-
86
-
87
-
88
-
89
-
90
-
91
-
92
-
93
-
94
-
95
-
96
-
97
-
98
-
99
-
100
-
101
-
102
-
103
-
104
-
105
-
106
-
107
-
108
-
109
-
110
-
111
-
112
-
113
-
114
-
115
-
116
-
117
-
118
-
119
-
120
-
121
-
122
-
123
-
124
-
125
-
126
-
127
-
128
-
129
-
130
-
131
-
132
-
133
-
134
-
135
-
136
-
137
-
138
-
139
-
140
-
141
-
142
-
143
-
144
-
145
-
146
-
147
-
148
-
149
-
150
-
151
-
152
-
153
-
154
-
155
-
156
-
157
-
158
-
159
-
160
-
161
-
162
-
163
-
164
-
165
-
166
-
167
-
168
-
169
-
170
-
171
-
172
-
173
-
174
-
175
-
176
-
177
-
178
-
179
-
180
-
181
-
182
-
183
-
184
-
185
-
186
-
187
-
188
-
189
-
190
-
191
-
192
-
193
-
194
-
195
-
196
 |
 |

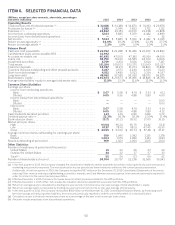
ITEM 6. SELECTED FINANCIAL DATA
(Millions, except per share amounts, share data, percentages
and where indicated) 2015 2014 2013 2012 2011
Operating Results
Total revenues net of interest expense (a) ............................ $ 32,818 $ 34,188 $ 32,870 $ 31,461 $ 29,876
Provisions for losses (b) ........................................... 1,988 2,044 1,832 1,712 1,112
Expenses (a) (c) ................................................... 22,892 23,153 23,150 23,298 21,808
Income from continuing operations ................................. 5,163 5,885 5,359 4,482 4,899
Income (loss) from discontinued operations ......................... ————36
Net income ...................................................... $ 5,163 $ 5,885 $ 5,359 $ 4,482 $ 4,935
Return on average equity (d) ....................................... 24.0% 29.1% 27.8% 23.1% 27.7%
Return on average assets (e) ....................................... 3.3% 3.8% 3.5% 3.0% 3.3%
Balance Sheet
Cash and cash equivalents ........................................ $ 22,762 $ 22,288 $ 19,486 $ 22,250 $ 24,893
Card Member loans and receivables HFS ............................ 14,992 ————
Accounts receivable, net .......................................... 46,695 47,000 47,185 45,914 44,109
Loans, net ....................................................... 58,799 70,104 66,585 64,309 61,166
Investment securities ............................................. 3,759 4,431 5,016 5,614 7,147
Total assets ..................................................... 161,184 159,103 153,375 153,140 153,337
Customer deposits ............................................... 54,997 44,171 41,763 39,803 37,898
Travelers Cheques outstanding and other prepaid products ........... 3,247 3,673 4,240 4,601 5,123
Short-term borrowings (f) .......................................... 4,812 3,480 5,021 3,314 4,337
Long-term debt .................................................. 48,061 57,955 55,330 58,973 59,570
Shareholders’ equity ............................................. $ 20,673 $ 20,673 $ 19,496 $ 18,886 $ 18,794
Average shareholders’ equity to average total assets ratio ............. 13.5% 13.1% 12.6% 12.9% 12.0%
Common Share Statistics
Earnings per share:
Income from continuing operations:
Basic ....................................................... $ 5.07 $ 5.58 $ 4.91 $ 3.91 $ 4.11
Diluted ...................................................... 5.05 5.56 4.88 3.89 4.09
Income (loss) from discontinued operations:
Basic ....................................................... —— — — 0.03
Diluted ...................................................... —— — — 0.03
Net income:
Basic ....................................................... 5.07 5.58 4.91 3.91 4.14
Diluted ...................................................... 5.05 5.56 4.88 3.89 4.12
Cash dividends declared per share ................................. 1.13 1.01 0.89 0.80 0.72
Dividend payout ratio (g) ........................................... 22.3% 18.1% 18.1% 20.5% 17.4%
Book value per share ............................................. 19.71 20.21 18.32 17.09 16.15
Market price per share:
High .......................................................... 93.94 96.24 90.79 61.42 53.8
Low .......................................................... 67.57 78.41 58.31 47.40 41.30
Close ......................................................... $ 69.55 $ 93.04 $ 90.73 $ 57.48 $ 47.17
Average common shares outstanding for earnings per share:
Basic ......................................................... 999 1,045 1,082 1,135 1,178
Diluted ........................................................ 1,003 1,051 1,089 1,141 1,184
Shares outstanding at period end .................................. 969 1,023 1,064 1,105 1,164
Other Statistics
Number of employees at period end (thousands):
United States .................................................. 21 22 26 27 29
Outside the United States ....................................... 34 32 37 37 33
Total (h) ....................................................... 55 54 63 64 62
Number of shareholders of record .................................. 24,704 25,767 22,238 32,565 35,541
(a) In the first quarter of 2015, the Company changed the classification related to certain payments to partners reducing both discount revenue and
marketing and promotion expense. The misclassification in prior periods has been revised to conform to the current period presentation.
Additionally, in the first quarter of 2013, the Company reclassified $27 million on the December 31, 2012 Consolidated Statements of Income by
reducing Other revenue and reducing Marketing, promotion, rewards, and Card Member services expense, from amounts previously reported in
order to conform to the current period presentation.
(b) Effective December 1, 2015, Provisions for losses does not reflect provisions related to the HFS portfolios.
(c) Effective December 1, 2015, Other, net includes the valuation allowance adjustment associated with the HFS portfolios.
(d) Return on average equity is calculated by dividing one-year period of net income by one-year average of total shareholders’ equity.
(e) Return on average assets is calculated by dividing one-year period of net income by one-year average of total assets.
(f) In the first quarter of 2012, the Company reclassified $913 million on the December 31, 2011 Consolidated Balance Sheets, by increasing short-
term borrowings and reducing other liabilities, from amounts previously reported in order to correct the effect of a misclassification.
(g) Calculated on year’s dividends declared per share as a percentage of the year’s net income per basic share.
(h) Amounts include employees from discontinued operations.
50