American Express 2015 Annual Report Download - page 93
Download and view the complete annual report
Please find page 93 of the 2015 American Express annual report below. You can navigate through the pages in the report by either clicking on the pages listed below, or by using the keyword search tool below to find specific information within the annual report.-
 1
1 -
2
-
3
-
4
-
5
-
6
-
7
-
8
-
9
-
10
-
11
-
12
-
13
-
14
-
15
-
16
-
17
-
18
-
19
-
20
-
21
-
22
-
23
-
24
-
25
-
26
-
27
-
28
-
29
-
30
-
31
-
32
-
33
-
34
-
35
-
36
-
37
-
38
-
39
-
40
-
41
-
42
-
43
-
44
-
45
-
46
-
47
-
48
-
49
-
50
-
51
-
52
-
53
-
54
-
55
-
56
-
57
-
58
-
59
-
60
-
61
-
62
-
63
-
64
-
65
-
66
-
67
-
68
-
69
-
70
-
71
-
72
-
73
-
74
-
75
-
76
-
77
-
78
-
79
-
80
-
81
-
82
-
 83
83 -
 84
84 -
 85
85 -
 86
86 -
 87
87 -
 88
88 -
 89
89 -
 90
90 -
 91
91 -
 92
92 -
 93
93 -
 94
94 -
 95
95 -
 96
96 -
 97
97 -
 98
98 -
 99
99 -
 100
100 -
 101
101 -
 102
102 -
 103
103 -
104
-
105
-
106
-
107
-
108
-
109
-
110
-
111
-
112
-
113
-
114
-
115
-
116
-
117
-
118
-
119
-
120
-
121
-
122
-
123
-
124
-
125
-
126
-
127
-
128
-
129
-
130
-
131
-
132
-
133
-
134
-
135
-
136
-
137
-
138
-
139
-
140
-
141
-
142
-
143
-
144
-
145
-
146
-
147
-
148
-
149
-
150
-
151
-
152
-
153
-
154
-
155
-
156
-
157
-
158
-
159
-
160
-
161
-
162
-
163
-
164
-
165
-
166
-
167
-
168
-
169
-
170
-
171
-
172
-
173
-
174
-
175
-
176
-
177
-
178
-
179
-
180
-
181
-
182
-
183
-
184
-
185
-
186
-
187
-
188
-
189
-
190
-
191
-
192
-
193
-
194
-
195
-
196
 |
 |

Committed Bank Credit Facilities
In addition to the secured borrowing facilities described earlier in this section, we maintained a committed
syndicated bank credit facility as of December 31, 2015 of $3.0 billion, which expires on December 9, 2018. The
availability of this credit line is subject to our compliance with certain financial covenants, principally the maintenance
by American Express Credit Corporation (Credco) of a certain ratio of combined earnings and fixed charges to fixed
charges. As of December 31, 2015, we were in compliance with each of our covenants. As of December 31, 2015, no
amounts were drawn on the committed credit facility. The capacity of the facility mainly served to further enhance our
contingent funding resources.
Our committed bank credit facility does not contain a material adverse change clause, which might otherwise
preclude borrowing under the credit facility, nor is it dependent on our credit rating.
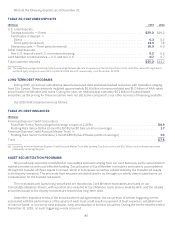
CASH FLOWS
The following table summarizes our cash flow activity, followed by a discussion of the major drivers impacting
operating, investing and financing cash flows.
TABLE 26: CASH FLOWS
(Billions) 2015 2014 2013
Total cash provided by (used in):
Operating activities ................................................................. $11.0 $11.0 $ 8.5
Investing activities .................................................................. (8.2) (8.0) (7.2)
Financing activities .................................................................. (2.0) — (3.9)
Effect of foreign currency exchange rates on cash and cash equivalents .................... (0.3) (0.2) (0.2)
Net increase (decrease) in cash and cash equivalents .................................... $ 0.5 $ 2.8 $(2.8)
Cash Flows from Operating Activities
Our cash flows from operating activities primarily include net income adjusted for (i) non-cash items included in
net income and (ii) changes in the balances of operating assets and liabilities, which can vary significantly in the normal
course of business due to the amount and timing of payments.
For December 31, 2015 and 2014, net cash provided by operating activities remained consistent at $11.0 billion in
both periods, driven by net income of $5.2 billion and $5.9 billion, respectively, adjusted for non-cash items including
certain changes in provisions for losses, depreciation and amortization, deferred taxes, and stock-based
compensation.
Cash Flows from Investing Activities
Our cash flows from investing activities primarily include changes in Card Member receivables and loans,
including Card Member loans and receivables HFS, as well as changes in our available for sale investment securities
portfolio.
For the year ended December 31, 2015 and 2014, net cash used in investing activities was $8.2 billion and $8.0
billion, respectively. Both periods primarily reflect an increase in Card Member receivables and loans, including the
HFS portfolios. In 2014, that increase was partially offset by the cash proceeds from the sale of our investment in
Concur.
Cash Flows from Financing Activities
Our cash flows from financing activities primarily include issuing and repaying debt, changes in customer
deposits, issuing and repurchasing our common shares, and paying dividends.
For the year ended December 31, 2015, net cash used in financing activities was $2.0 billion. For the year ended
December 31, 2014, net cash provided by financing activities was $11 million. The variance was primarily driven by an
increase in debt repayments in the current year versus the prior year, partially offset by a greater increase in customer
deposits in the current year versus the prior year.
82