American Express 2015 Annual Report Download - page 63
Download and view the complete annual report
Please find page 63 of the 2015 American Express annual report below. You can navigate through the pages in the report by either clicking on the pages listed below, or by using the keyword search tool below to find specific information within the annual report.-
 1
1 -
2
-
3
-
4
-
5
-
6
-
7
-
8
-
9
-
10
-
11
-
12
-
13
-
14
-
15
-
16
-
17
-
18
-
19
-
20
-
21
-
22
-
23
-
24
-
25
-
26
-
27
-
28
-
29
-
30
-
31
-
32
-
33
-
34
-
35
-
36
-
37
-
38
-
39
-
40
-
41
-
42
-
43
-
44
-
45
-
46
-
47
-
48
-
49
-
50
-
51
-
52
-
 53
53 -
 54
54 -
 55
55 -
 56
56 -
 57
57 -
 58
58 -
 59
59 -
 60
60 -
 61
61 -
 62
62 -
 63
63 -
 64
64 -
 65
65 -
 66
66 -
 67
67 -
 68
68 -
 69
69 -
 70
70 -
 71
71 -
 72
72 -
 73
73 -
74
-
75
-
76
-
77
-
78
-
79
-
80
-
81
-
82
-
83
-
84
-
85
-
86
-
87
-
88
-
89
-
90
-
91
-
92
-
93
-
94
-
95
-
96
-
97
-
98
-
99
-
100
-
101
-
102
-
103
-
104
-
105
-
106
-
107
-
108
-
109
-
110
-
111
-
112
-
113
-
114
-
115
-
116
-
117
-
118
-
119
-
120
-
121
-
122
-
123
-
124
-
125
-
126
-
127
-
128
-
129
-
130
-
131
-
132
-
133
-
134
-
135
-
136
-
137
-
138
-
139
-
140
-
141
-
142
-
143
-
144
-
145
-
146
-
147
-
148
-
149
-
150
-
151
-
152
-
153
-
154
-
155
-
156
-
157
-
158
-
159
-
160
-
161
-
162
-
163
-
164
-
165
-
166
-
167
-
168
-
169
-
170
-
171
-
172
-
173
-
174
-
175
-
176
-
177
-
178
-
179
-
180
-
181
-
182
-
183
-
184
-
185
-
186
-
187
-
188
-
189
-
190
-
191
-
192
-
193
-
194
-
195
-
196
 |
 |

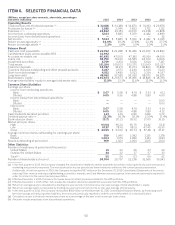
2014 results included:
• A $719 million ($453 million after-tax) gain on the sale of our investment in Concur Technologies (Concur) in the
fourth quarter;
• A $626 million ($409 million after-tax) gain as a result of the business travel joint venture transaction in the
second quarter;
• $420 million ($277 million after-tax) of net charges for costs related to reengineering initiatives, including $313
million ($206 million after-tax) and $133 million ($90 million after-tax) of restructuring charges in the fourth
and second quarter, respectively; and
• A $109 million ($68 million after-tax) charge related to the renewal of our partnership with Delta Air Lines
(Delta) in the fourth quarter.
2013 results included:
• A $66 million ($41 million after-tax) charge related to a proposed merchant litigation settlement in the fourth
quarter.
In addition, effective December 1, 2015, we transferred the Card Member loans and receivables related to our
cobrand partnerships with Costco Wholesale Corporation (Costco) in the United States and JetBlue Airways
Corporation (JetBlue) (the HFS portfolios) to Card Member loans and receivables held for sale (HFS) on the
Consolidated Balance Sheets. Refer to Note 2 to the “Consolidated Financial Statements” for additional information.
NON-GAAP MEASURES
We prepare our Consolidated Financial Statements in accordance with accounting principles generally accepted in
the United States of America (GAAP). However, certain information included within this report constitutes non-GAAP
financial measures. Our calculations of non-GAAP financial measures may differ from the calculations of similarly titled
measures by other companies.
BUSINESS ENVIRONMENT
Our performance in 2015 reflected both the strength of our business and the headwinds we have been managing
throughout the year. Results for the year benefited from healthy loan growth, strong card acquisitions, excellent credit
performance, disciplined operating expense control and the benefits of our strong capital position. Our results were also
challenged by several factors. First, the cumulative impact from the initial increased costs associated with early renewals of
certain of our cobrand relationships and the end of our relationship with Costco in Canada negatively impacted our results.
Second, the U.S. dollar continued to strengthen as the year progressed. Third, our decision to increase spending on growth
initiatives for the year, consistent with the elevated levels of 2014, further pressured our 2015 earnings. Fourth, the
economic, regulatory, and competitive environments all became even more challenging as the year progressed.
The combination of these factors resulted in billings and revenue growth rates that were fairly steady throughout
the year. Billings did grow in 2015, although growth rates decelerated modestly during the second half of the year.
International billed business continued to be strong versus the prior year after excluding Canada (due to the
termination of our relationship with Costco Canada last year) and adjusting for foreign currency exchange rates. In the
United States, we saw softening in billings on the Costco cobrand card, where volumes dropped versus the prior year.
Lower gas prices also continued to be a drag on billings. GCS billed business growth continued to slow due, in part, to
lower airline volumes and a generally cautious corporate spending environment. Our billings growth rates during the
second half of 2016 will be impacted by the end of our relationship with Costco in the United States, which is expected
to occur around mid-year.
For the full year, discount revenue was down slightly versus the prior year driven in part by a decline in our
discount rate due primarily to the continued rollout of OptBlue, and we anticipate that the discount rate will further
decline by a greater amount during 2016, due to the continued expansion of OptBlue, a greater impact from
international regulatory changes, and continued competitive pressures.
52