Charter 2003 Annual Report Download - page 150
Download and view the complete annual report
Please find page 150 of the 2003 Charter annual report below. You can navigate through the pages in the report by either clicking on the pages listed below, or by using the keyword search tool below to find specific information within the annual report.-
 1
1 -
2
-
3
-
4
-
5
-
6
-
7
-
8
-
9
-
10
-
11
-
12
-
13
-
14
-
15
-
16
-
17
-
18
-
19
-
20
-
21
-
22
-
23
-
24
-
25
-
26
-
27
-
28
-
29
-
30
-
31
-
32
-
33
-
34
-
35
-
36
-
37
-
38
-
39
-
40
-
41
-
42
-
43
-
44
-
45
-
46
-
47
-
48
-
49
-
50
-
51
-
52
-
53
-
54
-
55
-
56
-
57
-
58
-
59
-
60
-
61
-
62
-
63
-
64
-
65
-
66
-
67
-
68
-
69
-
70
-
71
-
72
-
73
-
74
-
75
-
76
-
77
-
78
-
79
-
80
-
81
-
82
-
83
-
84
-
85
-
86
-
87
-
88
-
89
-
90
-
91
-
92
-
93
-
94
-
95
-
96
-
97
-
98
-
99
-
100
-
101
-
102
-
103
-
104
-
105
-
106
-
107
-
108
-
109
-
110
-
111
-
112
-
113
-
114
-
115
-
116
-
117
-
118
-
119
-
120
-
121
-
122
-
123
-
124
-
125
-
126
-
127
-
128
-
129
-
130
-
131
-
132
-
133
-
134
-
135
-
136
-
137
-
138
-
139
-
 140
140 -
 141
141 -
 142
142 -
 143
143 -
 144
144 -
 145
145 -
 146
146 -
 147
147 -
 148
148 -
 149
149 -
 150
150 -
 151
151 -
 152
152 -
 153
153
 |
 |

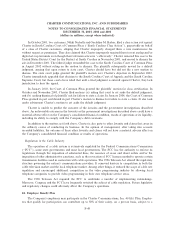
CHARTER COMMUNICATIONS, INC. AND SUBSIDIARIES
NOTES TO CONSOLIDATED FINANCIAL STATEMENTS
DECEMBER 31, 2003, 2002 and 2001
(dollars in millions, except where indicated)
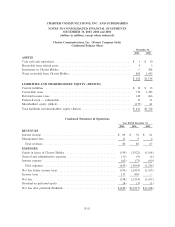
Condensed Statements of Cash Flows
2003 2002 2001
CASH FLOWS FROM OPERATING ACTIVITIES:
Net loss after preferred dividends ÏÏÏÏÏÏÏÏÏÏÏÏÏÏÏÏÏÏÏÏÏÏÏÏÏÏÏÏÏÏÏÏÏÏ $(242) $(2,517) $(1,168)
Equity in losses of Charter Holdco ÏÏÏÏÏÏÏÏÏÏÏÏÏÏÏÏÏÏÏÏÏÏÏÏÏÏÏÏÏÏÏÏÏ 359 2,922 1,168
Changes in operating assets and liabilities ÏÏÏÏÏÏÏÏÏÏÏÏÏÏÏÏÏÏÏÏÏÏÏÏÏÏÏ (9) 10 Ì
Deferred income taxesÏÏÏÏÏÏÏÏÏÏÏÏÏÏÏÏÏÏÏÏÏÏÏÏÏÏÏÏÏÏÏÏÏÏÏÏÏÏÏÏÏÏÏÏ (117) (405) Ì
Net cash Öows from operating activities ÏÏÏÏÏÏÏÏÏÏÏÏÏÏÏÏÏÏÏÏÏÏÏÏÏÏÏ (9) 10 Ì
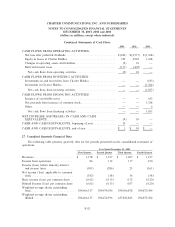
CASH FLOWS FROM INVESTING ACTIVITIES:
Investments in and receivables from Charter Holdco ÏÏÏÏÏÏÏÏÏÏÏÏÏÏÏÏÏÏ Ì Ì (633)
Investment in Charter Holdco ÏÏÏÏÏÏÏÏÏÏÏÏÏÏÏÏÏÏÏÏÏÏÏÏÏÏÏÏÏÏÏÏÏÏÏÏÏ Ì Ì (1,224)
Net cash Öows from investing activities ÏÏÏÏÏÏÏÏÏÏÏÏÏÏÏÏÏÏÏÏÏÏÏÏÏÏÏ Ì Ì (1,857)
CASH FLOWS FROM FINANCING ACTIVITIES
Issuance of convertible notes ÏÏÏÏÏÏÏÏÏÏÏÏÏÏÏÏÏÏÏÏÏÏÏÏÏÏÏÏÏÏÏÏÏÏÏÏÏÏ Ì Ì 633
Net proceeds from issuance of common stock ÏÏÏÏÏÏÏÏÏÏÏÏÏÏÏÏÏÏÏÏÏÏÏÏ Ì Ì 1,218
Other ÏÏÏÏÏÏÏÏÏÏÏÏÏÏÏÏÏÏÏÏÏÏÏÏÏÏÏÏÏÏÏÏÏÏÏÏÏÏÏÏÏÏÏÏÏÏÏÏÏÏÏÏÏÏÏÏÏÏ Ì Ì 6
Net cash Öows from Ñnancing activities ÏÏÏÏÏÏÏÏÏÏÏÏÏÏÏÏÏÏÏÏÏÏÏÏÏÏÏ Ì Ì 1,857
NET INCREASE (DECREASE) IN CASH AND CASH
EQUIVALENTSÏÏÏÏÏÏÏÏÏÏÏÏÏÏÏÏÏÏÏÏÏÏÏÏÏÏÏÏÏÏÏÏÏÏÏÏÏÏÏÏÏÏÏÏÏÏÏÏ (9) 10 Ì
CASH AND CASH EQUIVALENTS, beginning of year ÏÏÏÏÏÏÏÏÏÏÏÏÏÏÏ 10 Ì Ì
CASH AND CASH EQUIVALENTS, end of year ÏÏÏÏÏÏÏÏÏÏÏÏÏÏÏÏÏÏÏÏ $ 1 $ 10 $ Ì
27. Unaudited Quarterly Financial Data
The following table presents quarterly data for the periods presented on the consolidated statement of
operations:
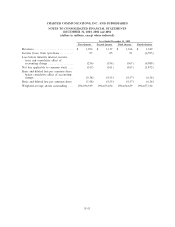
Year Ended December 31, 2003
First Quarter Second Quarter Third Quarter Fourth Quarter
RevenuesÏÏÏÏÏÏÏÏÏÏÏÏÏÏÏÏÏÏÏÏÏÏÏÏÏÏÏÏ $ 1,178 $ 1,217 $ 1,207 $ 1,217
Income from operations ÏÏÏÏÏÏÏÏÏÏÏÏÏÏÏ 86 112 117 210
Income (loss) before minority interest
and income taxes ÏÏÏÏÏÏÏÏÏÏÏÏÏÏÏÏÏÏÏ (301) (286) 23 (161)
Net income (loss) applicable to common
stock ÏÏÏÏÏÏÏÏÏÏÏÏÏÏÏÏÏÏÏÏÏÏÏÏÏÏÏÏÏ (182) (38) 36 (58)
Basic income (loss) per common share ÏÏ (0.62) (0.13) 0.12 (0.20)
Diluted Income (loss) per common share (0.62) (0.13) 0.07 (0.20)
Weighted-average shares outstanding,
basicÏÏÏÏÏÏÏÏÏÏÏÏÏÏÏÏÏÏÏÏÏÏÏÏÏÏÏÏÏÏ 294,466,137 294,474,596 294,566,878 294,875,504
Weighted-average shares outstanding,
diluted ÏÏÏÏÏÏÏÏÏÏÏÏÏÏÏÏÏÏÏÏÏÏÏÏÏÏÏÏ 294,466,137 294,474,596 637,822,843 294,875,504
F-52