Charter 2003 Annual Report Download - page 39
Download and view the complete annual report
Please find page 39 of the 2003 Charter annual report below. You can navigate through the pages in the report by either clicking on the pages listed below, or by using the keyword search tool below to find specific information within the annual report.-
 1
1 -
2
-
3
-
4
-
5
-
6
-
7
-
8
-
9
-
10
-
11
-
12
-
13
-
14
-
15
-
16
-
17
-
18
-
19
-
20
-
21
-
22
-
23
-
24
-
25
-
26
-
27
-
28
-
 29
29 -
 30
30 -
 31
31 -
 32
32 -
 33
33 -
 34
34 -
 35
35 -
 36
36 -
 37
37 -
 38
38 -
 39
39 -
 40
40 -
 41
41 -
 42
42 -
 43
43 -
 44
44 -
 45
45 -
 46
46 -
 47
47 -
 48
48 -
 49
49 -
50
-
51
-
52
-
53
-
54
-
55
-
56
-
57
-
58
-
59
-
60
-
61
-
62
-
63
-
64
-
65
-
66
-
67
-
68
-
69
-
70
-
71
-
72
-
73
-
74
-
75
-
76
-
77
-
78
-
79
-
80
-
81
-
82
-
83
-
84
-
85
-
86
-
87
-
88
-
89
-
90
-
91
-
92
-
93
-
94
-
95
-
96
-
97
-
98
-
99
-
100
-
101
-
102
-
103
-
104
-
105
-
106
-
107
-
108
-
109
-
110
-
111
-
112
-
113
-
114
-
115
-
116
-
117
-
118
-
119
-
120
-
121
-
122
-
123
-
124
-
125
-
126
-
127
-
128
-
129
-
130
-
131
-
132
-
133
-
134
-
135
-
136
-
137
-
138
-
139
-
140
-
141
-
142
-
143
-
144
-
145
-
146
-
147
-
148
-
149
-
150
-
151
-
152
-
153
 |
 |
(b) In connection with this transaction, at the closing we and Charter Holdco acquired all of the outstanding
stock of Cable USA and the assets of related aÇliates in exchange for cash and 505,664 shares of
Charter Series A convertible redeemable preferred stock. In the Ñrst quarter of 2003, an additional
$0.34 million in cash was paid and 39,595 additional shares of Charter Series A convertible redeemable
preferred stock were issued to certain sellers.
All acquisitions were accounted for under the purchase method of accounting and results of operations
were included in our consolidated Ñnancial statements from their respective dates of acquisition.
We have no current plans to pursue any signiÑcant acquisitions. However, we will continue to evaluate
opportunities to consolidate our operations through the sale of cable systems to, or exchange of like-kind assets
with, other cable operators as such opportunities arise, and on a very limited basis, consider strategic new
acquisitions. Our primary criteria in considering these opportunities are the rationalization of our operations
into geographic clusters and the potential Ñnancial beneÑts we expect to ultimately realize as a result of the
sale, exchange, or acquisition.
Overview of Operations
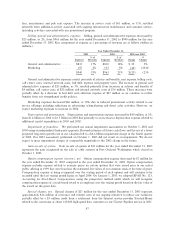
Approximately 86% and 84% of our revenues for the years ended December 31, 2003 and 2002,
respectively, are attributable to monthly subscription fees charged to customers for our video, high-speed data,
telephone and commercial services provided by our cable systems. Generally, these customer subscriptions
may be discontinued by the customer at any time. The remaining 14% and 16%, respectively, of revenue is
derived primarily from pay-per-view and VOD programming where users are charged a fee for individual
programs viewed, advertising revenues, installation or reconnection fees charged to customers to commence or
reinstate service, commissions related to the sale of merchandise by home shopping services and franchise fee
revenues, which are collected by us but then paid to local franchising authorities. We have generated increased
revenues during the past three years, primarily through the sale of digital video and high-speed data services to
new and existing customers, price increases on video services and customer growth from acquisitions. Going
forward, our strategy is to grow revenues and improve margins by seeking to stabilize our analog video
customer base and increase revenues per customer. To accomplish this, we are increasing prices for certain
services and we are oÅering new bundling of services combining digital video and our advanced services (such
as high-speed data service and high deÑnition television) at what we believe are attractive price points. In
addition, we are increasing our marketing eÅorts and budget in 2004 to promote our high-speed data services,
digital video services and advanced products and services such as digital video recorders, high deÑnition
television and telephony using VOIP to our existing customer base and to commercial customers. See
""Business Ì Sales and Marketing'' for more details.
Our success in our eÅorts to grow revenues and improve margins will be impacted by our ability to
compete against companies with often fewer regulatory burdens, easier access to Ñnancing, greater personnel
resources, greater brand name recognition and long-established relationships with regulatory authorities and
customers. Additionally, controlling our cost of operations is critical, particularly cable programming costs,
which have historically increased at rates in excess of inÖation and are expected to continue to increase. See
""Business Ì Programming'' for more details. We are attempting to control our costs of operations by
maintaining strict controls on expenses. More speciÑcally, we are focused on managing our cost structure by
renegotiating programming agreements to reduce the rate of historical increases in programming cost,
managing our workforce to control increases and improve productivity, and leveraging our size in purchasing
activities.
Our expenses primarily consist of operating costs, selling, general and administrative expenses, deprecia-
tion and amortization expense and interest expense. Operating costs primarily include programming costs, the
cost of our workforce, cable service related expenses, advertising sales costs, franchise fees and expenses
related to customer billings. For the year ended December 31, 2003, income from operations was $516 million
and for the years ended December 31, 2002 and 2001, our loss from operations was $4.3 billion and
$1.2 billion, respectively. Operating margin, which is deÑned as income (loss) from operations divided by
revenues, was 11% for the year ended December 31, 2003, whereas for the years ending December 31, 2002
37