Charter 2003 Annual Report Download - page 46
Download and view the complete annual report
Please find page 46 of the 2003 Charter annual report below. You can navigate through the pages in the report by either clicking on the pages listed below, or by using the keyword search tool below to find specific information within the annual report.-
 1
1 -
2
-
3
-
4
-
5
-
6
-
7
-
8
-
9
-
10
-
11
-
12
-
13
-
14
-
15
-
16
-
17
-
18
-
19
-
20
-
21
-
22
-
23
-
24
-
25
-
26
-
27
-
28
-
29
-
30
-
31
-
32
-
33
-
34
-
35
-
 36
36 -
 37
37 -
 38
38 -
 39
39 -
 40
40 -
 41
41 -
 42
42 -
 43
43 -
 44
44 -
 45
45 -
 46
46 -
 47
47 -
 48
48 -
 49
49 -
 50
50 -
 51
51 -
 52
52 -
 53
53 -
 54
54 -
 55
55 -
 56
56 -
57
-
58
-
59
-
60
-
61
-
62
-
63
-
64
-
65
-
66
-
67
-
68
-
69
-
70
-
71
-
72
-
73
-
74
-
75
-
76
-
77
-
78
-
79
-
80
-
81
-
82
-
83
-
84
-
85
-
86
-
87
-
88
-
89
-
90
-
91
-
92
-
93
-
94
-
95
-
96
-
97
-
98
-
99
-
100
-
101
-
102
-
103
-
104
-
105
-
106
-
107
-
108
-
109
-
110
-
111
-
112
-
113
-
114
-
115
-
116
-
117
-
118
-
119
-
120
-
121
-
122
-
123
-
124
-
125
-
126
-
127
-
128
-
129
-
130
-
131
-
132
-
133
-
134
-
135
-
136
-
137
-
138
-
139
-
140
-
141
-
142
-
143
-
144
-
145
-
146
-
147
-
148
-
149
-
150
-
151
-
152
-
153
 |
 |

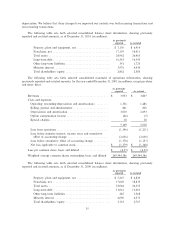
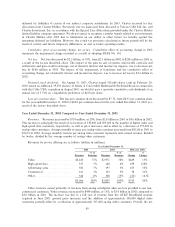
Results of Operations
The following table sets forth the percentages of revenues that items in the accompanying consolidated
statements of operations constitute for the indicated periods (dollars in millions, except per share and share
data):
Year Ended December 31,
2003 2002 2001
RevenuesÏÏÏÏÏÏÏÏÏÏÏÏÏÏÏÏÏÏÏÏÏÏÏÏ $ 4,819 100% $ 4,566 100% $ 3,807 100%
Costs and Expenses:
Operating (excluding depreciation
and amortization) ÏÏÏÏÏÏÏÏÏÏÏÏ 1,952 40% 1,807 40% 1,486 39%
Selling, general and administrative 940 19% 963 21% 826 22%
Depreciation and amortization ÏÏÏÏ 1,479 31% 1,439 31% 2,693 71%
Impairment of franchises ÏÏÏÏÏÏÏÏ Ì Ì 4,638 102% Ì Ì
Gain on sale of system ÏÏÏÏÏÏÏÏÏÏ (21) Ì Ì Ì Ì Ì
Option compensation expense
(income), net ÏÏÏÏÏÏÏÏÏÏÏÏÏÏÏÏ 4 Ì 5 Ì (5) Ì
Special charges, net ÏÏÏÏÏÏÏÏÏÏÏÏÏ 21 Ì 36 1% 18 Ì
Unfavorable contracts and other
settlements ÏÏÏÏÏÏÏÏÏÏÏÏÏÏÏÏÏÏ (72) (1)% Ì Ì Ì Ì
4,303 89% 8,888 195% 5,018 132%
Income (loss) from operationsÏÏÏÏÏÏ 516 11% (4,322) (95)% (1,211) (32)%
Interest expense, net ÏÏÏÏÏÏÏÏÏÏÏÏÏÏ (1,557) (1,503) (1,310)
Gain (loss) on derivative instruments
and hedging activities, netÏÏÏÏÏÏÏÏ 65 (115) (50)
Gain on debt exchange, net ÏÏÏÏÏÏÏÏ 267 Ì Ì
Loss on equity investments ÏÏÏÏÏÏÏÏÏ (3) (3) (54)
Other, net ÏÏÏÏÏÏÏÏÏÏÏÏÏÏÏÏÏÏÏÏÏÏÏ (13) (1) (5)
Loss before minority interest, income
taxes and cumulative eÅect of
accounting change ÏÏÏÏÏÏÏÏÏÏÏÏÏÏ (725) (5,944) (2,630)
Minority interestÏÏÏÏÏÏÏÏÏÏÏÏÏÏÏÏÏÏ 377 3,176 1,461
Loss before income taxes and
cumulative eÅect of accounting
change ÏÏÏÏÏÏÏÏÏÏÏÏÏÏÏÏÏÏÏÏÏÏÏÏ (348) (2,768) (1,169)
Income tax beneÑt ÏÏÏÏÏÏÏÏÏÏÏÏÏÏÏÏ 110 460 12
Loss before cumulative eÅect of
accounting change ÏÏÏÏÏÏÏÏÏÏÏÏÏÏ (238) (2,308) (1,157)
Cumulative eÅect of accounting
change, net of tax ÏÏÏÏÏÏÏÏÏÏÏÏÏÏ Ì (206) (10)
Net lossÏÏÏÏÏÏÏÏÏÏÏÏÏÏÏÏÏÏÏÏÏÏÏÏÏ (238) (2,514) (1,167)
Dividends on preferred stock Ì
redeemable ÏÏÏÏÏÏÏÏÏÏÏÏÏÏÏÏÏÏÏÏ (4) (3) (1)
Net loss applicable to common stock $ (242) $ (2,517) $ (1,168)
Loss per common share, basic and
diluted ÏÏÏÏÏÏÏÏÏÏÏÏÏÏÏÏÏÏÏÏÏÏÏÏ $ (0.82) $ (8.55) $ (4.33)
Weighted average common shares
outstanding ÏÏÏÏÏÏÏÏÏÏÏÏÏÏÏÏÏÏÏÏ 294,597,519 294,440,261 269,594,386
44