Charter 2003 Annual Report Download - page 38
Download and view the complete annual report
Please find page 38 of the 2003 Charter annual report below. You can navigate through the pages in the report by either clicking on the pages listed below, or by using the keyword search tool below to find specific information within the annual report.-
 1
1 -
2
-
3
-
4
-
5
-
6
-
7
-
8
-
9
-
10
-
11
-
12
-
13
-
14
-
15
-
16
-
17
-
18
-
19
-
20
-
21
-
22
-
23
-
24
-
25
-
26
-
27
-
 28
28 -
 29
29 -
 30
30 -
 31
31 -
 32
32 -
 33
33 -
 34
34 -
 35
35 -
 36
36 -
 37
37 -
 38
38 -
 39
39 -
 40
40 -
 41
41 -
 42
42 -
 43
43 -
 44
44 -
 45
45 -
 46
46 -
 47
47 -
 48
48 -
49
-
50
-
51
-
52
-
53
-
54
-
55
-
56
-
57
-
58
-
59
-
60
-
61
-
62
-
63
-
64
-
65
-
66
-
67
-
68
-
69
-
70
-
71
-
72
-
73
-
74
-
75
-
76
-
77
-
78
-
79
-
80
-
81
-
82
-
83
-
84
-
85
-
86
-
87
-
88
-
89
-
90
-
91
-
92
-
93
-
94
-
95
-
96
-
97
-
98
-
99
-
100
-
101
-
102
-
103
-
104
-
105
-
106
-
107
-
108
-
109
-
110
-
111
-
112
-
113
-
114
-
115
-
116
-
117
-
118
-
119
-
120
-
121
-
122
-
123
-
124
-
125
-
126
-
127
-
128
-
129
-
130
-
131
-
132
-
133
-
134
-
135
-
136
-
137
-
138
-
139
-
140
-
141
-
142
-
143
-
144
-
145
-
146
-
147
-
148
-
149
-
150
-
151
-
152
-
153
 |
 |

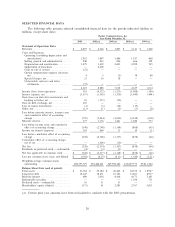
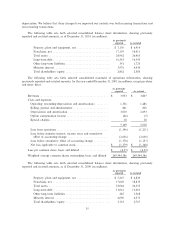
The following table sets forth selected consolidated statement of operations information, showing
previously reported and restated amounts, for the year ended December 31, 2000 (in millions, except per share
and share data):
As previously
reported As restated
RevenuesÏÏÏÏÏÏÏÏÏÏÏÏÏÏÏÏÏÏÏÏÏÏÏÏÏÏÏÏÏÏÏÏÏÏÏÏÏÏÏÏÏÏÏÏÏÏÏÏ $ 3,249 $ 3,141
Costs and expenses:
Operating (excluding depreciation and amortization) ÏÏÏÏÏÏÏÏÏ 1,036 1,187
Selling, general and administrative ÏÏÏÏÏÏÏÏÏÏÏÏÏÏÏÏÏÏÏÏÏÏÏÏ 670 606
Depreciation and amortization ÏÏÏÏÏÏÏÏÏÏÏÏÏÏÏÏÏÏÏÏÏÏÏÏÏÏÏÏ 2,473 2,398
Stock compensation expenseÏÏÏÏÏÏÏÏÏÏÏÏÏÏÏÏÏÏÏÏÏÏÏÏÏÏÏÏÏÏ 41 38
4,220 4,229
Loss from operations ÏÏÏÏÏÏÏÏÏÏÏÏÏÏÏÏÏÏÏÏÏÏÏÏÏÏÏÏÏÏÏÏÏÏ (971) (1,088)
Loss before minority interest and income taxes ÏÏÏÏÏÏÏÏÏÏÏÏ (2,055) (2,148)
Net lossÏÏÏÏÏÏÏÏÏÏÏÏÏÏÏÏÏÏÏÏÏÏÏÏÏÏÏÏÏÏÏÏÏÏÏÏÏÏÏÏÏÏÏÏÏÏÏ $ (829) $ (858)
Loss per common share, basic and diluted ÏÏÏÏÏÏÏÏÏÏÏÏÏÏÏÏÏÏÏÏ $ (3.67) $ (3.80)
Weighted average common shares outstanding, basic and diluted 225,697,775 225,697,775
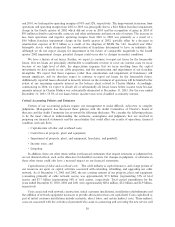
The following table sets forth selected consolidated cash Öow information, showing previously reported
and restated amounts, for the years ended December 31, 2001 and 2000 (in millions):
2001 2000
As previously As As previously As
reported restated reported restated
Net cash from operating activities ÏÏÏÏÏÏÏÏÏÏÏÏ $ 519 $ 489 $ 1,131 $ 828
Net cash from investing activities ÏÏÏÏÏÏÏÏÏÏÏÏ (4,809) (4,774) (4,054) (3,751)
Net cash from Ñnancing activities ÏÏÏÏÏÏÏÏÏÏÏÏ $ 4,162 $ 4,156 $ 2,920 $ 2,920
Acquisitions
The following table sets forth information regarding our acquisitions from January 1, 2001 to Decem-
ber 31, 2002 (none in 2003):
Purchase Price (Dollars in Millions)
Securities
Acquisition Cash Issued/Other Total Acquired
Date Paid Consideration Price Customers
AT&T Systems ÏÏÏÏÏÏÏÏÏÏÏÏÏÏÏÏÏÏÏÏÏÏÏÏÏÏ 6/01 1,711 25 1,736(a) 551,100
Cable USA ÏÏÏÏÏÏÏÏÏÏÏÏÏÏÏÏÏÏÏÏÏÏÏÏÏÏÏÏÏ 8/01 45 55(b) 100 30,600
Total 2001 Acquisitions ÏÏÏÏÏÏÏÏÏÏÏÏÏÏÏ 1,756 80 1,836 581,700
High Speed Access Corp. ÏÏÏÏÏÏÏÏÏÏÏÏÏÏÏÏÏ 2/02 78 Ì 78 N/A
Enstar Limited Partnership SystemsÏÏÏÏÏÏÏÏÏ 4/02 48 Ì 48 21,600
Enstar Income Program II-1, L.P. ÏÏÏÏÏÏÏÏÏÏ 9/02 15 Ì 15 6,400
Total 2002 Acquisitions ÏÏÏÏÏÏÏÏÏÏÏÏÏÏÏ 141 Ì 141 28,000
Total 2001-2002 Acquisitions ÏÏÏÏÏÏÏÏÏÏ $1,897 $80 $1,977 609,700
(a) Comprised of $1.7 billion, as adjusted, in cash and a cable system located in Florida valued at $25 million,
as adjusted.
36