Charter 2003 Annual Report Download - page 59
Download and view the complete annual report
Please find page 59 of the 2003 Charter annual report below. You can navigate through the pages in the report by either clicking on the pages listed below, or by using the keyword search tool below to find specific information within the annual report.-
 1
1 -
2
-
3
-
4
-
5
-
6
-
7
-
8
-
9
-
10
-
11
-
12
-
13
-
14
-
15
-
16
-
17
-
18
-
19
-
20
-
21
-
22
-
23
-
24
-
25
-
26
-
27
-
28
-
29
-
30
-
31
-
32
-
33
-
34
-
35
-
36
-
37
-
38
-
39
-
40
-
41
-
42
-
43
-
44
-
45
-
46
-
47
-
48
-
 49
49 -
 50
50 -
 51
51 -
 52
52 -
 53
53 -
 54
54 -
 55
55 -
 56
56 -
 57
57 -
 58
58 -
 59
59 -
 60
60 -
 61
61 -
 62
62 -
 63
63 -
 64
64 -
 65
65 -
 66
66 -
 67
67 -
 68
68 -
 69
69 -
70
-
71
-
72
-
73
-
74
-
75
-
76
-
77
-
78
-
79
-
80
-
81
-
82
-
83
-
84
-
85
-
86
-
87
-
88
-
89
-
90
-
91
-
92
-
93
-
94
-
95
-
96
-
97
-
98
-
99
-
100
-
101
-
102
-
103
-
104
-
105
-
106
-
107
-
108
-
109
-
110
-
111
-
112
-
113
-
114
-
115
-
116
-
117
-
118
-
119
-
120
-
121
-
122
-
123
-
124
-
125
-
126
-
127
-
128
-
129
-
130
-
131
-
132
-
133
-
134
-
135
-
136
-
137
-
138
-
139
-
140
-
141
-
142
-
143
-
144
-
145
-
146
-
147
-
148
-
149
-
150
-
151
-
152
-
153
 |
 |
Operating activities provided $259 million more cash in 2002 than in 2001 primarily due to increased
revenues of $759 million over 2001 and changes in operating assets and liabilities that provided $65 million
more cash in 2002 than in 2001 oÅset in part by increases in operating expenses and cash interest expense.
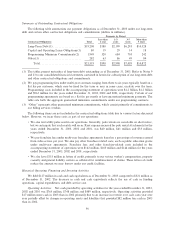
Investing Activities. Net cash used in investing activities for the years ended December 31, 2003, 2002
and 2001 was $817 million, $2.4 billion and $4.8 billion, respectively. Investing activities used $1.5 billion less
cash in 2003 than in 2002 primarily as a result of reductions in capital expenditures and acquisitions.
Purchases of property, plant and equipment used $1.3 billion less cash in 2003 than in 2002 as a result of
reduced rebuild and upgrade activities and our eÅorts to reduce capital expenditures. Payments for
acquisitions used $139 million less cash in 2003 than in 2002.
Investing activities used $2.4 billion less cash in 2002 than in 2001 primarily as a result of reductions in
capital expenditures and acquisitions. Purchases of property, plant and equipment used $746 million less cash
in 2002 than in 2001 as a result of our eÅorts to reduce capital expenditures. Payments for acquisitions used
$1.6 billion less cash in 2002 than in 2001.
Financing Activities. Net cash used in Ñnancing activities was $142 million for the year ended
December 31, 2003, whereas net cash provided by Ñnancing activities for the year ended December 31, 2002
and 2001 was $1.9 billion and $4.2 billion, respectively. Financing activities provided $2.1 billion less cash in
2003 than in 2002. The decrease in cash provided in 2003 compared to 2002 was primarily due to a decrease in
borrowings of long-term debt.
Financing activities provided $2.2 billion less cash in 2002 than in 2001. The decrease in cash provided in
2002 compared to 2001 was primarily due to a decrease in borrowings of long-term debt. In addition, in 2001
we received proceeds from the issuance of Class A common stock of $1.2 billion which did not recur in 2002.
These decreases in cash provided were oÅset partially by decreases in cash used for repayments of long-term
debt.
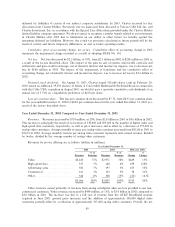
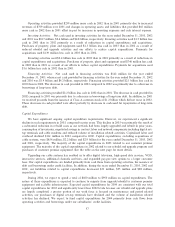
Capital Expenditures
We have signiÑcant ongoing capital expenditure requirements. However, we experienced a signiÑcant
decline in such requirements in 2003, compared to prior years. This decline in 2003 was primarily the result of
a substantial reduction in rebuild costs as our network had been largely upgraded and rebuilt in prior years,
consumption of inventories, negotiated savings in contract labor and network components including digital set-
top terminals and cable modems and reduced volume of installation related activities. Capitalized labor and
overhead declined $161 million in 2003 compared to 2002. Capital expenditures, excluding acquisitions of
cable systems, were $854 million, $2.2 billion and $2.9 billion for the years ended December 31, 2003, 2002
and 2001, respectively. The majority of the capital expenditures in 2003 related to our customer premise
equipment. The majority of the capital expenditures in 2002 related to our rebuild and upgrade program and
purchases of customer premise equipment. See the table on the next page for more details.
Upgrading our cable systems has enabled us to oÅer digital television, high-speed data services, VOD,
interactive services, additional channels and tiers, and expanded pay-per-view options to a larger customer
base. Our capital expenditures are funded primarily from cash Öows from operating activities, the issuance of
debt and borrowings under credit facilities. In addition, during the years ended December 31, 2003, 2002 and
2001, our liabilities related to capital expenditures decreased $33 million, $55 million and $88 million,
respectively.
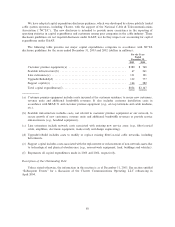
During 2004, we expect to spend a total of $850 million to $950 million on capital expenditures. The
nature of these expenditures is expected to continue to migrate from upgrade/rebuild to customer premise
equipment and scalable infrastructure. Expected capital expenditures for 2004 are consistent with our total
capital expenditures for 2003 and signiÑcantly lower than 2002 levels because our rebuild and upgrade plans
are largely completed, a greater portion of our work force is focused on maintenance and period related
activities, our purchases of digital set-top terminals have declined and the volume of installation related
activities has declined. We expect to fund capital expenditures for 2004 primarily from cash Öows from
operating activities and borrowings under our subsidiaries' credit facilities.
57