Charter 2003 Annual Report Download - page 49
Download and view the complete annual report
Please find page 49 of the 2003 Charter annual report below. You can navigate through the pages in the report by either clicking on the pages listed below, or by using the keyword search tool below to find specific information within the annual report.-
 1
1 -
2
-
3
-
4
-
5
-
6
-
7
-
8
-
9
-
10
-
11
-
12
-
13
-
14
-
15
-
16
-
17
-
18
-
19
-
20
-
21
-
22
-
23
-
24
-
25
-
26
-
27
-
28
-
29
-
30
-
31
-
32
-
33
-
34
-
35
-
36
-
37
-
38
-
 39
39 -
 40
40 -
 41
41 -
 42
42 -
 43
43 -
 44
44 -
 45
45 -
 46
46 -
 47
47 -
 48
48 -
 49
49 -
 50
50 -
 51
51 -
 52
52 -
 53
53 -
 54
54 -
 55
55 -
 56
56 -
 57
57 -
 58
58 -
 59
59 -
60
-
61
-
62
-
63
-
64
-
65
-
66
-
67
-
68
-
69
-
70
-
71
-
72
-
73
-
74
-
75
-
76
-
77
-
78
-
79
-
80
-
81
-
82
-
83
-
84
-
85
-
86
-
87
-
88
-
89
-
90
-
91
-
92
-
93
-
94
-
95
-
96
-
97
-
98
-
99
-
100
-
101
-
102
-
103
-
104
-
105
-
106
-
107
-
108
-
109
-
110
-
111
-
112
-
113
-
114
-
115
-
116
-
117
-
118
-
119
-
120
-
121
-
122
-
123
-
124
-
125
-
126
-
127
-
128
-
129
-
130
-
131
-
132
-
133
-
134
-
135
-
136
-
137
-
138
-
139
-
140
-
141
-
142
-
143
-
144
-
145
-
146
-
147
-
148
-
149
-
150
-
151
-
152
-
153
 |
 |

fees, maintenance and pole rent expense. The increase in service costs of $61 million, or 11%, resulted
primarily from additional activity associated with ongoing infrastructure maintenance and customer service,
including activities associated with our promotional program.
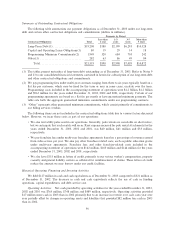
Selling, general and administrative expenses. Selling, general and administrative expenses decreased by
$23 million, or 2%, from $963 million for the year ended December 31, 2002 to $940 million for the year
ended December 31, 2003. Key components of expense as a percentage of revenues are as follows (dollars in
millions):
Year Ended December 31,
2003 2002 2003 over 2002
% of % of %
Expenses Revenues Expenses Revenues Change Change
General and administrative ÏÏÏÏÏÏÏ $833 17% $810 18% $ 23 3%
MarketingÏÏÏÏÏÏÏÏÏÏÏÏÏÏÏÏÏÏÏÏÏÏ 107 2% 153 3% (46) (30)%
$940 19% $963 21% $(23) (2)%
General and administrative expenses consist primarily of salaries and beneÑts, rent expense, billing costs,
call center costs, internal network costs, bad debt expense and property taxes. The increase in general and
administrative expenses of $23 million, or 3%, resulted primarily from increases in salaries and beneÑts of
$4 million, call center costs of $25 million and internal network costs of $16 million. These increases were
partially oÅset by a decrease in bad debt and collection expense of $27 million as we continue to realize
beneÑts from our strengthened credit policies.
Marketing expenses decreased $46 million, or 30%, due to reduced promotional activity related to our
service oÅerings including reductions in advertising, telemarketing and direct sales activities. However, we
expect marketing expenses to increase in 2004.
Depreciation and amortization. Depreciation and amortization expense increased by $40 million, or 3%,
from $1.4 billion in 2002 to $1.5 billion in 2003 due primarily to an increase in depreciation expense related to
additional capital expenditures in 2003 and 2002.
Impairment of franchises. We performed our annual impairment assessments on October 1, 2002 and
2003 using an independent third-party appraiser. Revised estimates of future cash Öows and the use of a lower
projected long-term growth rate in our valuation led to a $4.6 billion impairment charge in the fourth quarter
of 2002. Our 2003 assessment performed on October 1, 2003 did not result in an impairment. We do not
expect to incur impairment charges of comparable magnitude to the 2002 charge in the future.
Gain on sale of system. Gain on sale of system of $21 million for the year ended December 31, 2003
represents the gain recognized on the sale of cable systems in Port Orchard, Washington which closed on
October 1, 2003.
Option compensation expense (income), net. Option compensation expense decreased by $1 million for
the year ended December 31, 2003 compared to the year ended December 31, 2002. Option compensation
expense includes expense related to exercise prices on certain options that were issued prior to our initial
public oÅering in 1999 that were less than the estimated fair values of our common stock at the time of grant.
Compensation expense is being recognized over the vesting period of such options and will continue to be
recorded until the last vesting period lapses in April 2004. On January 1, 2003, we adopted SFAS No. 123,
Accounting for Stock-Based Compensation, using the prospective method under which we will recognize
compensation expense of a stock-based award to an employee over the vesting period based on the fair value of
the award on the grant date.
Special charges, net. Special charges of $21 million for the year ended December 31, 2003 represent
approximately $26 million of severance and related costs of our ongoing initiative to reduce our workforce
partially oÅset by a $5 million credit from a settlement from the Internet service provider Excite@Home
related to the conversion of about 145,000 high-speed data customers to our Charter Pipeline service in 2001.
47