Charter 2003 Annual Report Download - page 51
Download and view the complete annual report
Please find page 51 of the 2003 Charter annual report below. You can navigate through the pages in the report by either clicking on the pages listed below, or by using the keyword search tool below to find specific information within the annual report.-
 1
1 -
2
-
3
-
4
-
5
-
6
-
7
-
8
-
9
-
10
-
11
-
12
-
13
-
14
-
15
-
16
-
17
-
18
-
19
-
20
-
21
-
22
-
23
-
24
-
25
-
26
-
27
-
28
-
29
-
30
-
31
-
32
-
33
-
34
-
35
-
36
-
37
-
38
-
39
-
40
-
 41
41 -
 42
42 -
 43
43 -
 44
44 -
 45
45 -
 46
46 -
 47
47 -
 48
48 -
 49
49 -
 50
50 -
 51
51 -
 52
52 -
 53
53 -
 54
54 -
 55
55 -
 56
56 -
 57
57 -
 58
58 -
 59
59 -
 60
60 -
 61
61 -
62
-
63
-
64
-
65
-
66
-
67
-
68
-
69
-
70
-
71
-
72
-
73
-
74
-
75
-
76
-
77
-
78
-
79
-
80
-
81
-
82
-
83
-
84
-
85
-
86
-
87
-
88
-
89
-
90
-
91
-
92
-
93
-
94
-
95
-
96
-
97
-
98
-
99
-
100
-
101
-
102
-
103
-
104
-
105
-
106
-
107
-
108
-
109
-
110
-
111
-
112
-
113
-
114
-
115
-
116
-
117
-
118
-
119
-
120
-
121
-
122
-
123
-
124
-
125
-
126
-
127
-
128
-
129
-
130
-
131
-
132
-
133
-
134
-
135
-
136
-
137
-
138
-
139
-
140
-
141
-
142
-
143
-
144
-
145
-
146
-
147
-
148
-
149
-
150
-
151
-
152
-
153
 |
 |

deferred tax liabilities of certain of our indirect corporate subsidiaries. In 2003, Charter received tax loss
allocations from Charter Holdco. Previously, the tax losses had been allocated to Vulcan Cable III, Inc. and
Charter Investment, Inc. in accordance with the Special Loss Allocations provided under the Charter Holdco
limited liability company agreement. We do not expect to recognize a similar beneÑt related to our investment
in Charter Holdco after 2003 due to limitations on our ability to oÅset future tax beneÑts against the
remaining deferred tax liabilities. However, the actual tax provision calculation in future periods will be the
result of current and future temporary diÅerences, as well as future operating results.
Cumulative eÅect of accounting change, net of tax. Cumulative eÅect of accounting change in 2002
represents the impairment charge recorded as a result of adopting SFAS No. 142.
Net loss. Net loss decreased by $2.3 billion, or 91%, from $2.5 billion in 2002 to $238 million in 2003 as
a result of the factors described above. The impact of the gain on sale of system, unfavorable contracts and
settlements and gain on debt exchange, net of minority interest and income tax impacts, was to decrease net
loss by $168 million in 2003. The impact of the impairment of franchises and the cumulative eÅect of
accounting change, net of minority interest and income tax impacts, was to increase net loss by $1.6 billion in
2002.
Preferred stock dividends. On August 31, 2001, Charter issued 505,664 shares (and on February 28,
2003 issued an additional 39,595 shares) of Series A Convertible Redeemable Preferred Stock in connection
with the Cable USA acquisition in August 2001, on which it pays a quarterly cumulative cash dividends at an
annual rate of 5.75% on a liquidation preference of $100 per share.
Loss per common share. The loss per common share decreased by $7.73, from $8.55 per common share
for the year ended December 31, 2002 to $0.82 per common share for the year ended December 31, 2003 as a
result of the factors described above.
Year Ended December 31, 2002 Compared to Year Ended December 31, 2001
Revenues. Revenues increased by $759 million, or 20%, from $3.8 billion in 2001 to $4.6 billion in 2002.
This increase is principally the result of an increase of 538,000 and 585,200 in the number of digital video and
high-speed data customers, respectively, as well as price increases, and is oÅset by a decrease of 357,400 in
analog video customers. Average monthly revenue per analog video customer increased from $45.68 in 2001 to
$56.91 in 2002. Average monthly revenue per analog video customer represents total annual revenue, divided
by twelve, divided by the average number of analog video customers.
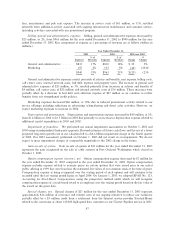
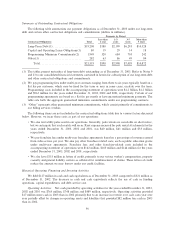
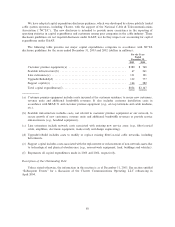
Revenues by service oÅering are as follows (dollars in millions):
Year Ended December 31,
2002 2001 2002 over 2001
% of % of %
Revenues Revenues Revenues Revenues Change Change
VideoÏÏÏÏÏÏÏÏÏÏÏÏÏÏÏÏÏÏÏÏÏÏÏÏÏÏ $3,420 75% $2,971 78% $449 15%
High-speed dataÏÏÏÏÏÏÏÏÏÏÏÏÏÏÏÏÏ 337 7% 148 4% 189 128%
Advertising sales ÏÏÏÏÏÏÏÏÏÏÏÏÏÏÏÏ 302 7% 197 5% 105 53%
Commercial ÏÏÏÏÏÏÏÏÏÏÏÏÏÏÏÏÏÏÏÏ 161 3% 123 3% 38 31%
OtherÏÏÏÏÏÏÏÏÏÏÏÏÏÏÏÏÏÏÏÏÏÏÏÏÏÏ 346 8% 368 10% (22) (6)%
$4,566 100% $3,807 100% $759 20%
Video revenues consist primarily of revenues from analog and digital video services provided to our non-
commercial customers. Video revenues increased by $449 million, or 15%, to $3.4 billion in 2002 compared to
$3.0 billion in 2001. The increase was due to a full year of revenue from the AT&T Broadband systems
acquired in June 2001, general price increases and the addition of approximately 538,000 digital video
customers partially oÅset by a reduction of approximately 357,400 analog video customers. Overall, the net
49